


International intermodal was the main driver of the double-digit growth in Q1 intermodal volume. (Photo: Jim Allen/FreightWaves)
Intermodal Data Analysis from SONAR serves a wide range of customers, from multinational shippers to container size, carriers, logistics companies, consultancies, government agencies, and buy- and sell-side stock analysts. The use cases for SONAR’s Intermodal Data Analysis are varied and significant. For example, shippers can leverage Intermodal Data Analysis volume data by lane to gauge whether other shippers find value in rail intermodal compared to truckload.
Meanwhile, drayage carriers utilize Intermodal Data Analysis to assess inbound volume, measured at the point of origin, to forecast local demand in the coming days (see blog for detail). Additionally, the granular and high-frequency characteristics of SONAR’s Intermodal Data Analysis aid analysts in positioning their portfolios or recommendations ahead of quarterly earnings reports.
Domestic Versus International Intermodal
In discussions with experts like Larry Gross from the Intermodal Association of North America (IANA), it’s emphasized that domestic and international intermodal should be treated as distinct segments. Within the intermodal industry, the terms “domestic” and “international” pertain to container size, which further segments the industry by carrier type.
International rail intermodal (also known as intact or IPI) involves the movement of 40-, 20-, and 45-foot containers — the same container size used for overseas shipping — whereas domestic containerized intermodal involves 53-foot container size that stay within North America.
Both segments handle imported goods, but domestic container size often include freight that has been transloaded from oceangoing container size near the port of entry. These segments compete for some imported freight; international usually offers a lower-cost option, while domestic often provides faster transit times with higher-priority rail service.
Publicly traded multimodal carriers such as J.B. Hunt, Hub Group, and Schneider exclusively participate in the domestic market. Therefore, analyzing quarterly results using data from the Association of American Railroads (AAR) and Class I railroads can be misleading.
These data sets, published weekly, mix domestic and international container size and include loaded and empty container size being repositioned (revenue-empties). Data from IANA correctly segments international versus domestic, but past experiences as a stock analyst showed that this data is often too retrospective to estimate quarterly earnings effectively.
A Tale of Two Markets
The international segment is influenced more by imports clearing customs, while the domestic segment is driven by the truckload market. This year, international intermodal volume has been supported by robust import volumes as shippers replenish inventories.
In contrast, domestic intermodal volume has faced challenges from competitive truckload markets, especially for routes originating and terminating in the eastern US, such as from Chicago to Atlanta. The large volume of container size sent to inland hubs like Chicago indicates a surplus of oceangoing containers in the market.
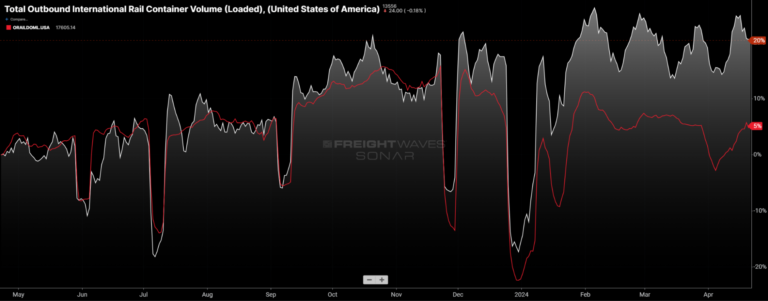
Compared to last year at this time, loaded international intermodal volume (white line) has outperformed domestic intermodal volume (red line).
J.B. Hunt’s Results Reflect Domestic Intermodal Market Conditions
Last week, J.B. Hunt posted a first-quarter earnings miss. I believe part of the reason for the miss was a matter of expectations that were based on volume that more closely resembled the double-digit year-over-year growth reported by the AAR. The volume breakdown in SONAR reveals that the strength in the AAR volume was driven by international volume, a segment that J.B. Hunt does not participate in.

Shares of J.B. Hunt traded down after the company reported earnings on Tuesday. Chart: Barchart.com Inc.
The more widely seen AAR data shows overall US containerized intermodal growth of 14.5% year over year in the first quarter (available in SONAR via the RTOIC.USA ticker).

Against easy year-ago comps, SONAR shows that loaded international intermodal volume increased more than 20% year over year. That is outside of J.B. Hunt’s market but still brings up the widely viewed AAR volume numbers.

Meanwhile, volume for loaded domestic containerized intermodal (ORAILDOML.USA), the market where J.B. Hunt is the largest participant, was elevated 3.2% year over year in Q1. That’s a lot closer to the flat intermodal volume that J.B. Hunt reported.
Analysts can take this analysis a step further by looking at volume by lane. I believe that LA to Chicago is J.B. Hunt’s densest intermodal lane, so analysts should pay particular attention to that in SONAR. Management said its volume in that lane was up by double digits in Q1 — that’s consistent with SONAR showing domestic volume up 19% in Q1.
Meanwhile, volumes in the more competitive Eastern lanes were more muted. For example, loaded domestic intermodal volume in the Chicago-to-Atlanta lane was up less than 1% year over year in Q1, according to SONAR.
SONAR Also Provides Insight Into Domestic Intermodal Pricing

At the same time, the IMCRPM1.USA SONAR ticker shows that rates were down 6.7%, excluding fuel surcharges, year over year in the first quarter. That data set is not a perfect comparison to J.B. Hunt’s financials because its reported revenue per load includes fuel. But it was fairly consistent with the 9.7% year-over-year decline (including fuel) that JBHT reported for intermodal revenue per load in Q1.
To learn more about the intermodal insights contained in SONAR, click here to connect with our team.