Optimize your network with better data for shippers and intelligent bidding

Balance spend and service to keep your freight moving for less
Screenshot of a SONAR dashboard displaying Supply Chain Intelligence (SCI)

Challenges Facing Shippers

  • Over-reliance on internal historical data hinders agility
  • Difficulty holding transportation partners accountable
  • Limited ability to monitor performance benchmarking
  • Lack of market intelligence to justify decisions

What's the SONAR ROI?

Use our calculator to find out.

By increasing the number of loaded miles per day your drivers drive by 1% and your rate per mile by $0.03 you will make more per week #WithSONAR.

#WithSONAR you can save up to per week through better bid negotiations and more effective management of your routing guide.

#WithSonar you can add 1 more load per person each day and increase $5 margin per load, earning your company an extra per week.

Disclaimer: Every company’s circumstances are unique. Fixed and variable expenses, market conditions and operational factors vary. Unforeseen events may also affect results. Calculated potential results reflect the consensus expectation of FreightWaves’ experts. Actual results may vary.

SONAR Supply Chain Intelligence for Shippers

SONAR’s data intelligence benefits shippers in all modes of transportation. Tackle day-to-day business decisions with more confidence. SONAR’s best-in-class data and analytics help intelligent shippers monitor carrier networks to optimize transportation spend and improve operational performance. Utilize SONAR data intelligence to develop a more accurate and dependable supply chain strategy and forecast disruption. Stay on top of supply and demand dynamics across all modes of transportation.


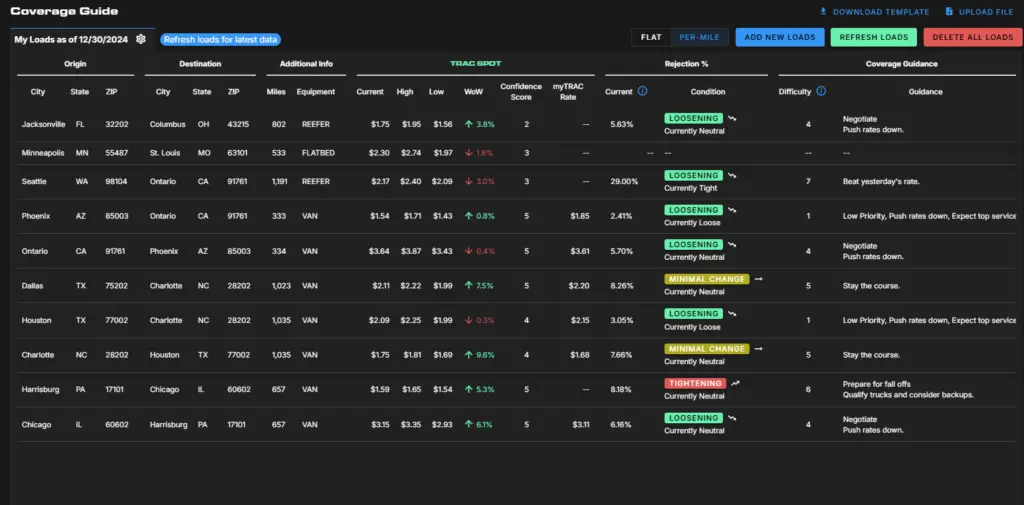
Coverage Guide: Your Freight Coverage Solution

 Coverage Guide streamlines load prioritization, rate evaluation, and freight coverage. As the cornerstone of our logistics toolkit, it addresses the unique challenges brokers face in today’s fast-paced industry.
Key Features & Benefits

  • Compare Rates and Availability: Quickly view market conditions to make informed decisions and maximize margins.

  • Intuitive Interface: Access vital information with a user-friendly design that boosts productivity.

  • Market Condition Tracking: Stay updated on trends to align strategies with real-time data.

  • Simplified Load Coverage: Identify which loads require minimal effort and where to focus attention.

 Why Use Coverage Guide?

Coverage Guide sets the stage for a full suite of tools tailored to the logistics industry. By focusing on the critical aspects of carrier sales, it empowers brokers to operate more efficiently, negotiate with confidence, and deliver superior service to their clients.

Start transforming your freight operations today with Coverage Guide—your first step towards a smarter, more streamlined logistics toolkit.

Improve Performance With High-Frequency Market Data

Third-party freight market data is a necessary part of logistics technology in the modern age. Shippers can quickly adjust to cyclical inflections with the right freight platform to drive freight savings while maintaining service through the use of robust, dynamic and comprehensive third party data.

SONAR offers users the fastest truckload, intermodal and ocean container data, collected at the point of booking, to provide granular insights into transportation costs and carrier service.

  • Analyze contract and spot rates paid out to carriers from freight invoices, collected daily
  • Understand lane-level tender acceptance trends to hold carriers accountable
  • Identify opportunities for targeted mini-bids to reduce cost and improve service
Freight Waves dashboard for improving retail logistics

Mitigate Risk and Find Cost Savings

The SONAR freight data intelligence platform equips shippers with actionable insights to make data-informed decisions – despite supply chain disruptions.

  • Utilize carrier invoice data to provide benchmark rates in over 700,000 lanes
  • Access FreightWaves’ tender data to measure compliance and capacity conditions
  • Use lane data summaries to categorize the biggest risks and opportunities

Quickly visualize transaction data to get a clear picture of your network performance

Gain visibility of your operations with a clearer picture of your freight, carriers and performance

Summary View

Summary View provides a control-tower-level dashboard of all uploaded lanes and summarizes:
  • Potential freight savings
  • Load count
  • Carbon footprint
  • Miles
Screenshot of a SONAR dashboard displaying supply chain intelligence (SCI)

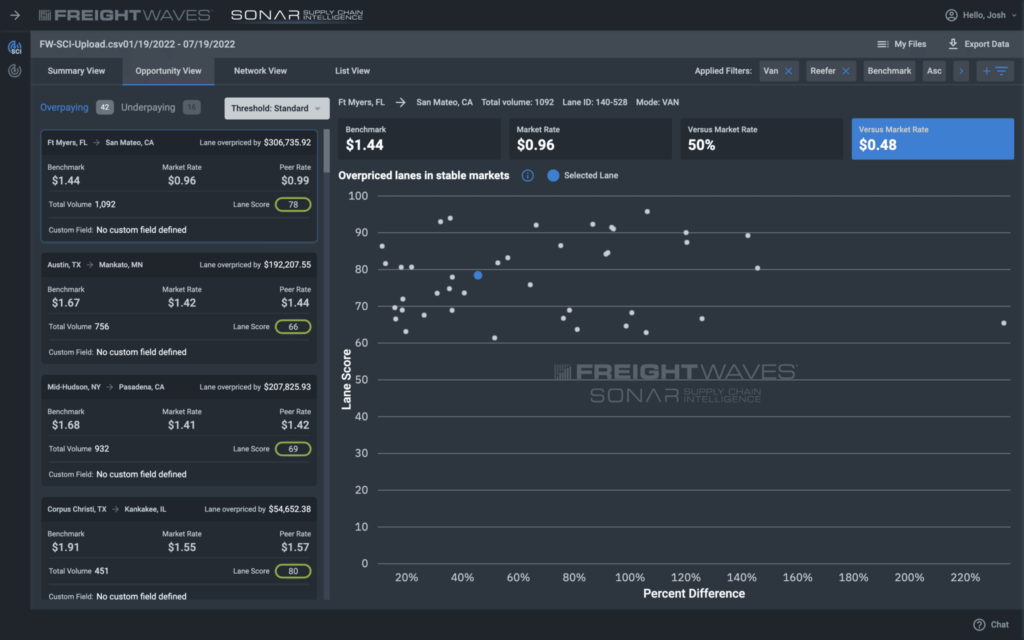
Opportunity View

Opportunity View outlines total freight spend risks and opportunities:

  • Highlights lanes with favorable capacity conditions
  • Pinpoints lanes contracted at higher or lower than market average rates
  • Identifies “quick win” options
image of a SONAR SCI list

Want to learn more about using SONAR SCI to improve network reliability and control costs?

Request a demo to talk with an expert
White Papers
January 13, 2025

SONAR December 2024 State of Freight

October 2, 2024

SONAR September State of Freight

September 13, 2024

Q3 Freight Rate Report