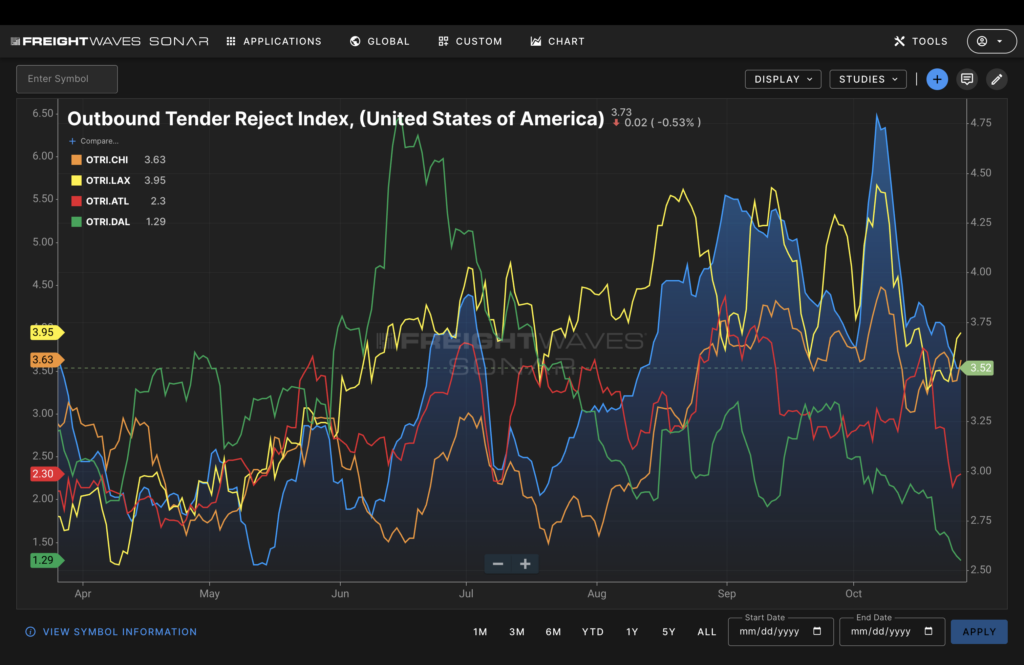
The current level of volatility is further compounded by:
Use our calculator to find out.
By increasing the number of loaded miles per day your drivers drive by 1% and your rate per mile by $0.03 you will make more per week #WithSONAR.
#WithSONAR you can save up to per week through better bid negotiations and more effective management of your routing guide.
#WithSonar you can add 1 more load per person each day and increase $5 margin per load, earning your company an extra per week.
Disclaimer: Every company’s circumstances are unique. Fixed and variable expenses, market conditions and operational factors vary. Unforeseen events may also affect results. Calculated potential results reflect the consensus expectation of FreightWaves’ experts. Actual results may vary.
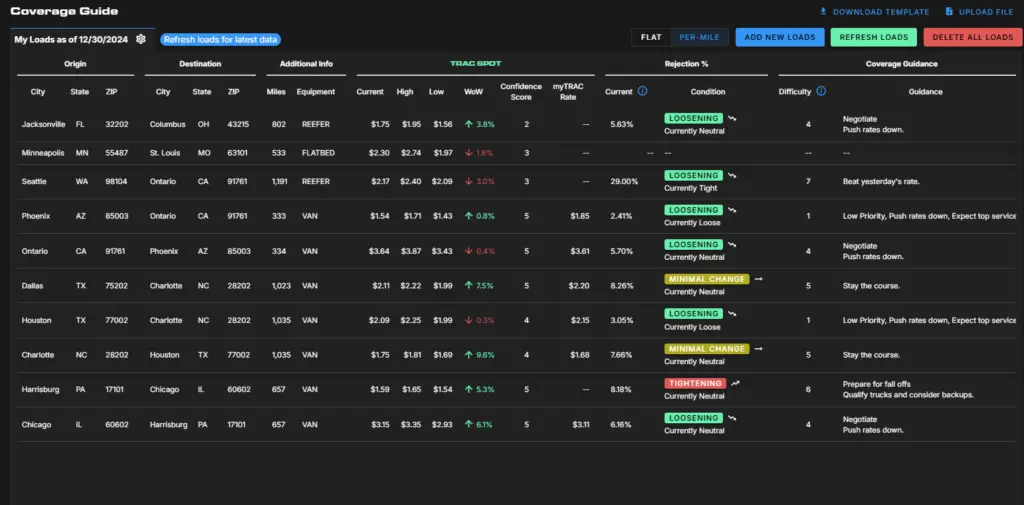
Coverage Guide streamlines load prioritization, rate evaluation, and freight coverage. As the cornerstone of our logistics toolkit, it addresses the unique challenges brokers face in today’s fast-paced industry.

Key Features & Benefits
Compare Rates and Availability: Quickly view market conditions to make informed decisions and maximize margins.
Intuitive Interface: Access vital information with a user-friendly design that boosts productivity.
Market Condition Tracking: Stay updated on trends to align strategies with real-time data.
Simplified Load Coverage: Identify which loads require minimal effort and where to focus attention.
Why Use Coverage Guide?
Coverage Guide sets the stage for a full suite of tools tailored to the logistics industry. By focusing on the critical aspects of carrier sales, it empowers brokers to operate more efficiently, negotiate with confidence, and deliver superior service to their clients.
Start transforming your freight operations today with Coverage Guide—your first step towards a smarter, more streamlined logistics toolkit.
Brokers and 3PLs utilize SONAR data intelligence for a strategic advantage over companies that rely on freight invoicing, loadboards, internal data or rates alone.


SONAR data helps brokers and 3PLs bid confidently, win more freight, widen margins and set buy rates accurately.


