SONAR is the only data source that aggregates and provides daily national and global-level data on the freight and consumer goods market.
View a video on how financial institutions use sonar data here: https://www.youtube.com/watch?v=2lc3Q_9Sor4
Use our calculator to find out.
By increasing the number of loaded miles per day your drivers drive by 1% and your rate per mile by $0.03 you will make more per week #WithSONAR.
#WithSONAR you can save up to per week through better bid negotiations and more effective management of your routing guide.
#WithSonar you can add 1 more load per person each day and increase $5 margin per load, earning your company an extra per week.
Disclaimer: Every company’s circumstances are unique. Fixed and variable expenses, market conditions and operational factors vary. Unforeseen events may also affect results. Calculated potential results reflect the consensus expectation of FreightWaves’ experts. Actual results may vary.
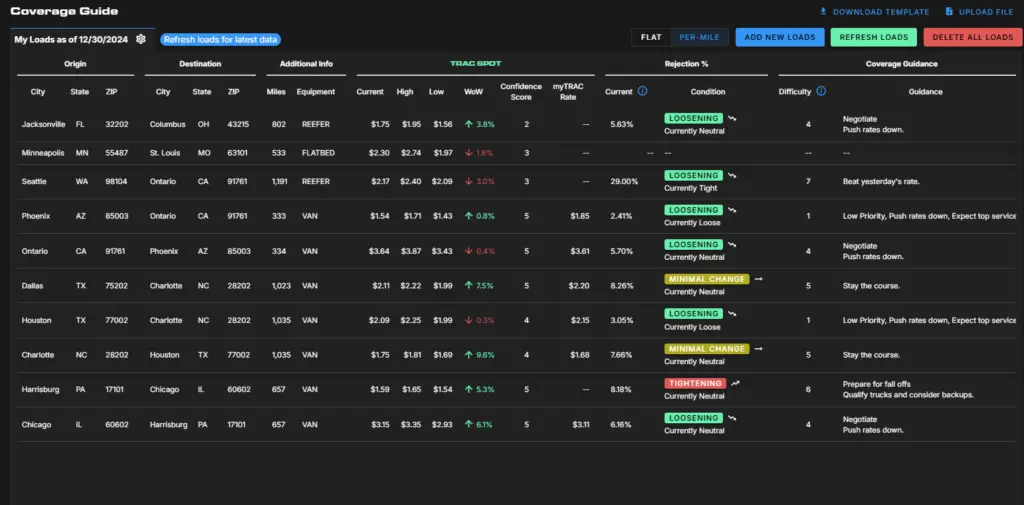
Coverage Guide streamlines load prioritization, rate evaluation, and freight coverage. As the cornerstone of our logistics toolkit, it addresses the unique challenges brokers face in today’s fast-paced industry.

Key Features & Benefits
Compare Rates and Availability: Quickly view market conditions to make informed decisions and maximize margins.
Intuitive Interface: Access vital information with a user-friendly design that boosts productivity.
Market Condition Tracking: Stay updated on trends to align strategies with real-time data.
Simplified Load Coverage: Identify which loads require minimal effort and where to focus attention.
Why Use Coverage Guide?
Coverage Guide sets the stage for a full suite of tools tailored to the logistics industry. By focusing on the critical aspects of carrier sales, it empowers brokers to operate more efficiently, negotiate with confidence, and deliver superior service to their clients.
Start transforming your freight operations today with Coverage Guide—your first step towards a smarter, more streamlined logistics toolkit.
Unlike any other industry data provider, most SONAR data is gathered at the point of booking, making it high-frequency and far less prone to error or bias. This changes the game in proactive calls and trading for financial professionals.
Rather than relying on batches of lagging data from industry players, SONAR reduces lag time from one to seven days on 93% of all data. This provides finance professionals and hedge funds with the clearest view into granular insights into consumer behavior, goods flows in retail distribution networks and manufacturing activity, allowing you to make calls ahead of the market and add more money to your bottom line.


SONAR provides a multimodal view of freight market dynamics so that financial institutions and hedge funds can assess risk, forecast growth, make informed trades and gain insight into how retailers and manufacturers react to the macroeconomic environment.

FreightWaves’ National Truckload Index (NTI) is a real-time proxy for the health of the national supply chain used by freight and non-freight businesses to make more accurate decisions. It provides real time visibility into changes in transportation cost, usually 3-6 months in advance of government data.

Manufacturing expenses and freight costs are inextricably linked. Financial professionals depend on SONAR data to indicate changes in capacity, which reflects supply and demand trends. Forecast pressures that clients face with certainty and provide a clear picture of what consumers may experience in the future.
