The stock market has been breaking records this week in anticipation of a trade deal with China. Assuming a trade deal comes to fruition, the impacts on global supply chains will be seen throughout SONAR. Here are a few examples that come to mind:
Ocean booking volume
An index of ocean booking volume in the China to US trade lane for 2022, 2023, 2024, and 2025, in green, pink, blue, and white, respectively. (Chart: SONAR)
The Container Atlas app contains indexes of ocean booking volume, available by date of booking and by date of departure. Ocean bookings volume from China to the US may pick up if a trade deal is struck. Ocean bookings in that lane have been counter to normal seasonality since the middle of last year and have been trending below 2023-2024 levels since early July when bookings spiked early. This year showed a lack of any meaningful demand surge ahead of China’s Golden Week. The Index above, which utilizes a 14-day moving average, is down 18% year over year.
Inventory levels
(Chart: SONAR Trade War Command Center)
Many shippers, particularly large ones, have worked to avoid tariffs through inventory management, and a trade deal could return inventory management to more normal practices. Upstream inventory levels have been elevated for the past several months, but nevertheless, the latest Logistics Managers’ Index shows that inventory levels and warehouse prices are still expanding. That could be related to the threat of even higher tariffs on China if November 1st passes without a trade deal. That said, both inventory levels and warehouse prices are now expanding at a slower pace than in the previous month. Shippers are now in the process of positioning inventory from upstream locations to locations closer to consumers, which is why multimodal carrier J.B. Hunt still expects a fall volume peak for rail intermodal despite expected depressed imports.
Ocean rates
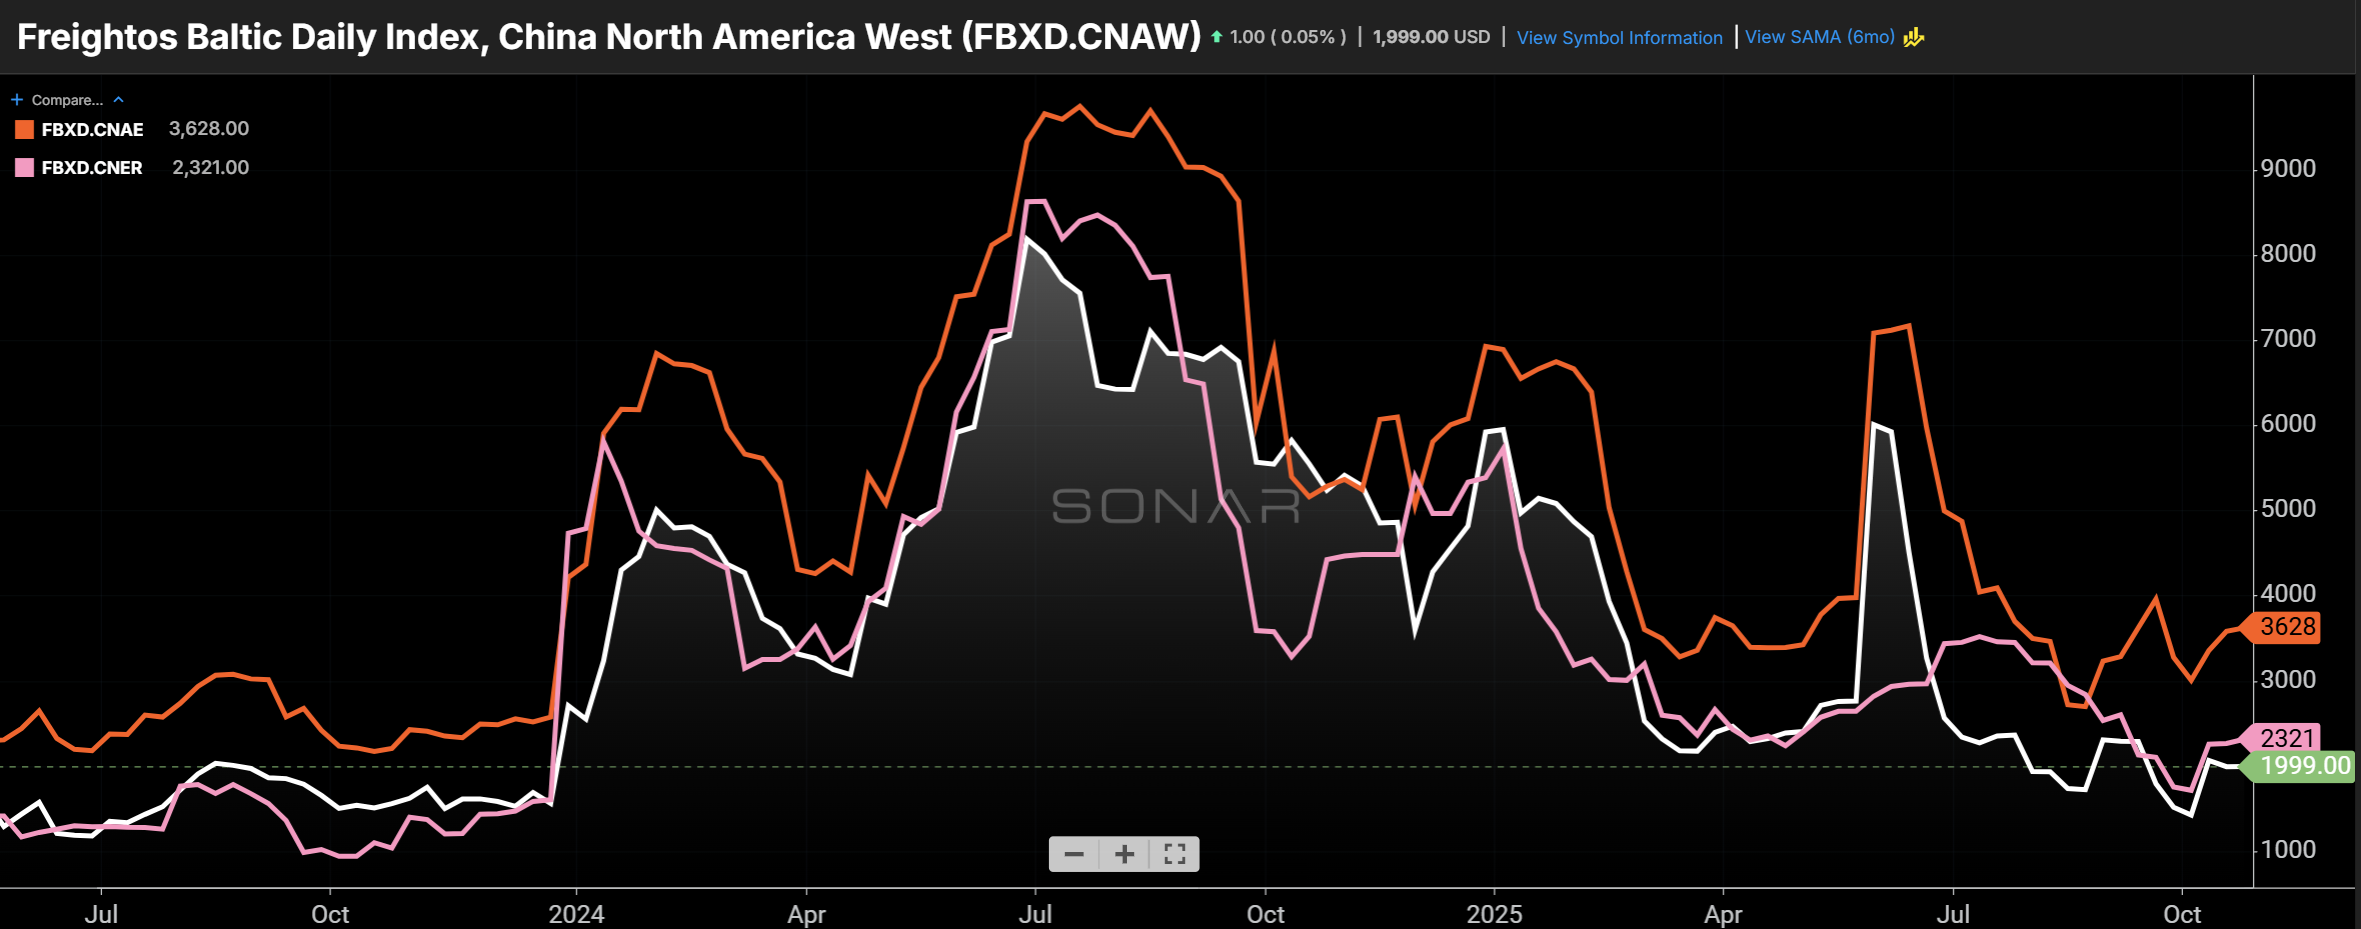
Spot rates to move 40’ containers from China to the US West Coast (white), the US East Coast (orange), and North Europe (pink) have all climbed since the start of the month. (Chart: SONAR) (Chart: SONAR)
The question tossed around the SONAR/FreightWaves this week, and the subject of Stuart Chirls’ latest article, was whether recent ocean GRIs will stick. Certainly, that’s more likely if a trade deal leads to an increase in demand. In the past month, spot rates to move 40’ containers in the China-to-USWC, China-to-USEC, and China-to-North Europe lanes are up 25%, 13%, and 11%, respectively. They are also substantially above the prevailing levels before the Red Sea attacks started in October 2023.
Port activity
(Chart: SONAR Trade War Command Center)
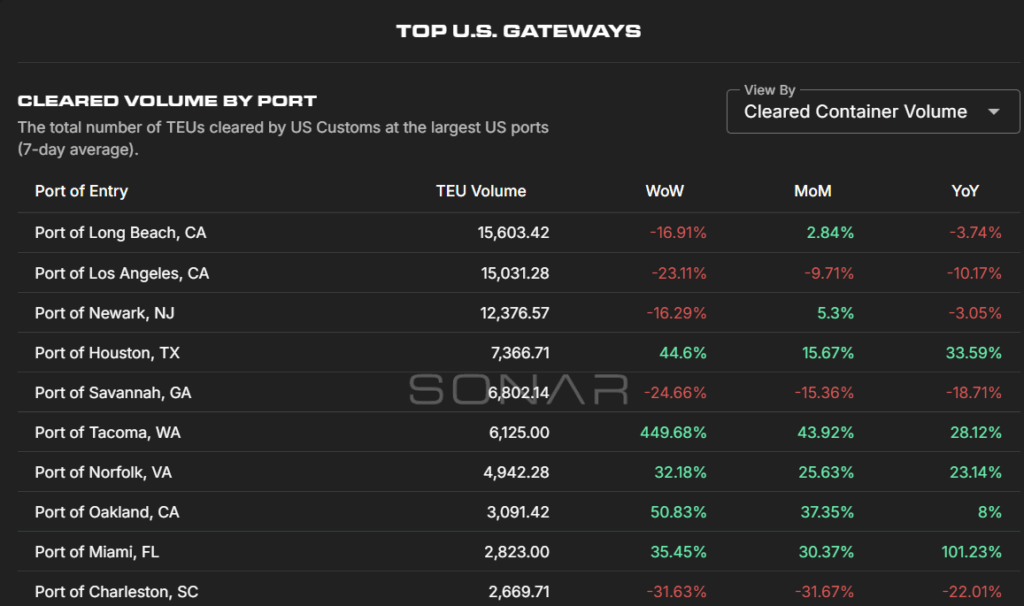
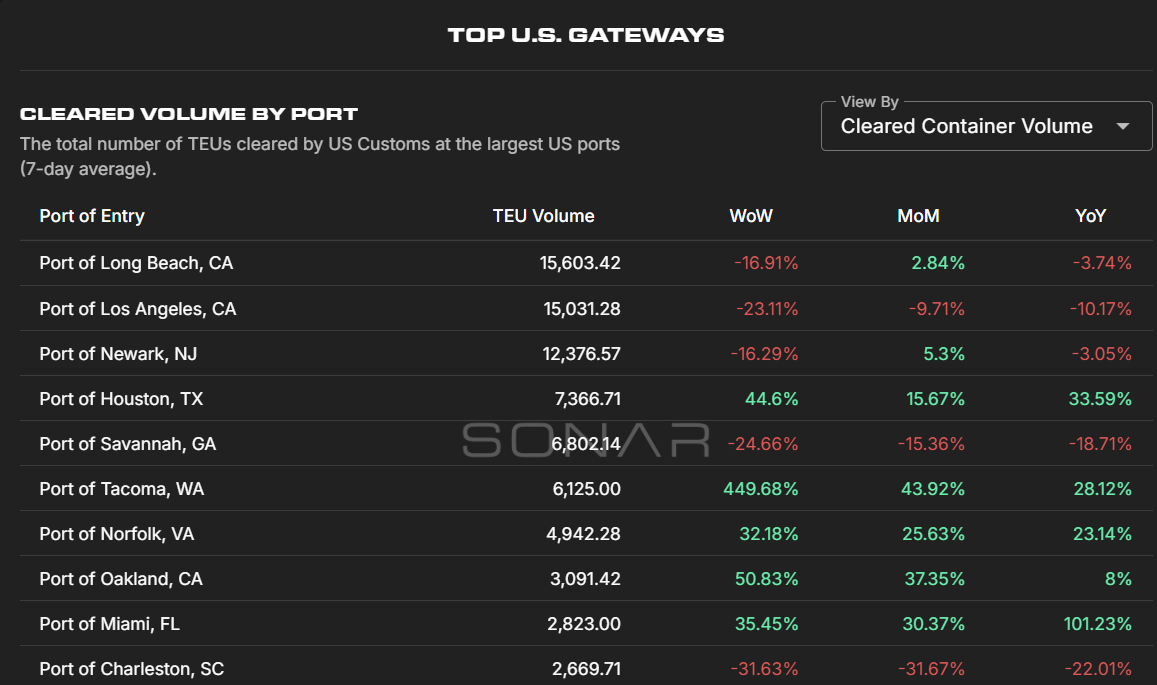
After setting records this summer, the ports of LA and Long Beach are both down year over year in the past week, with a weak fourth quarter expected. A trade deal could mitigate the fourth-quarter declines with a more solid end to the year.
International intermodal volume
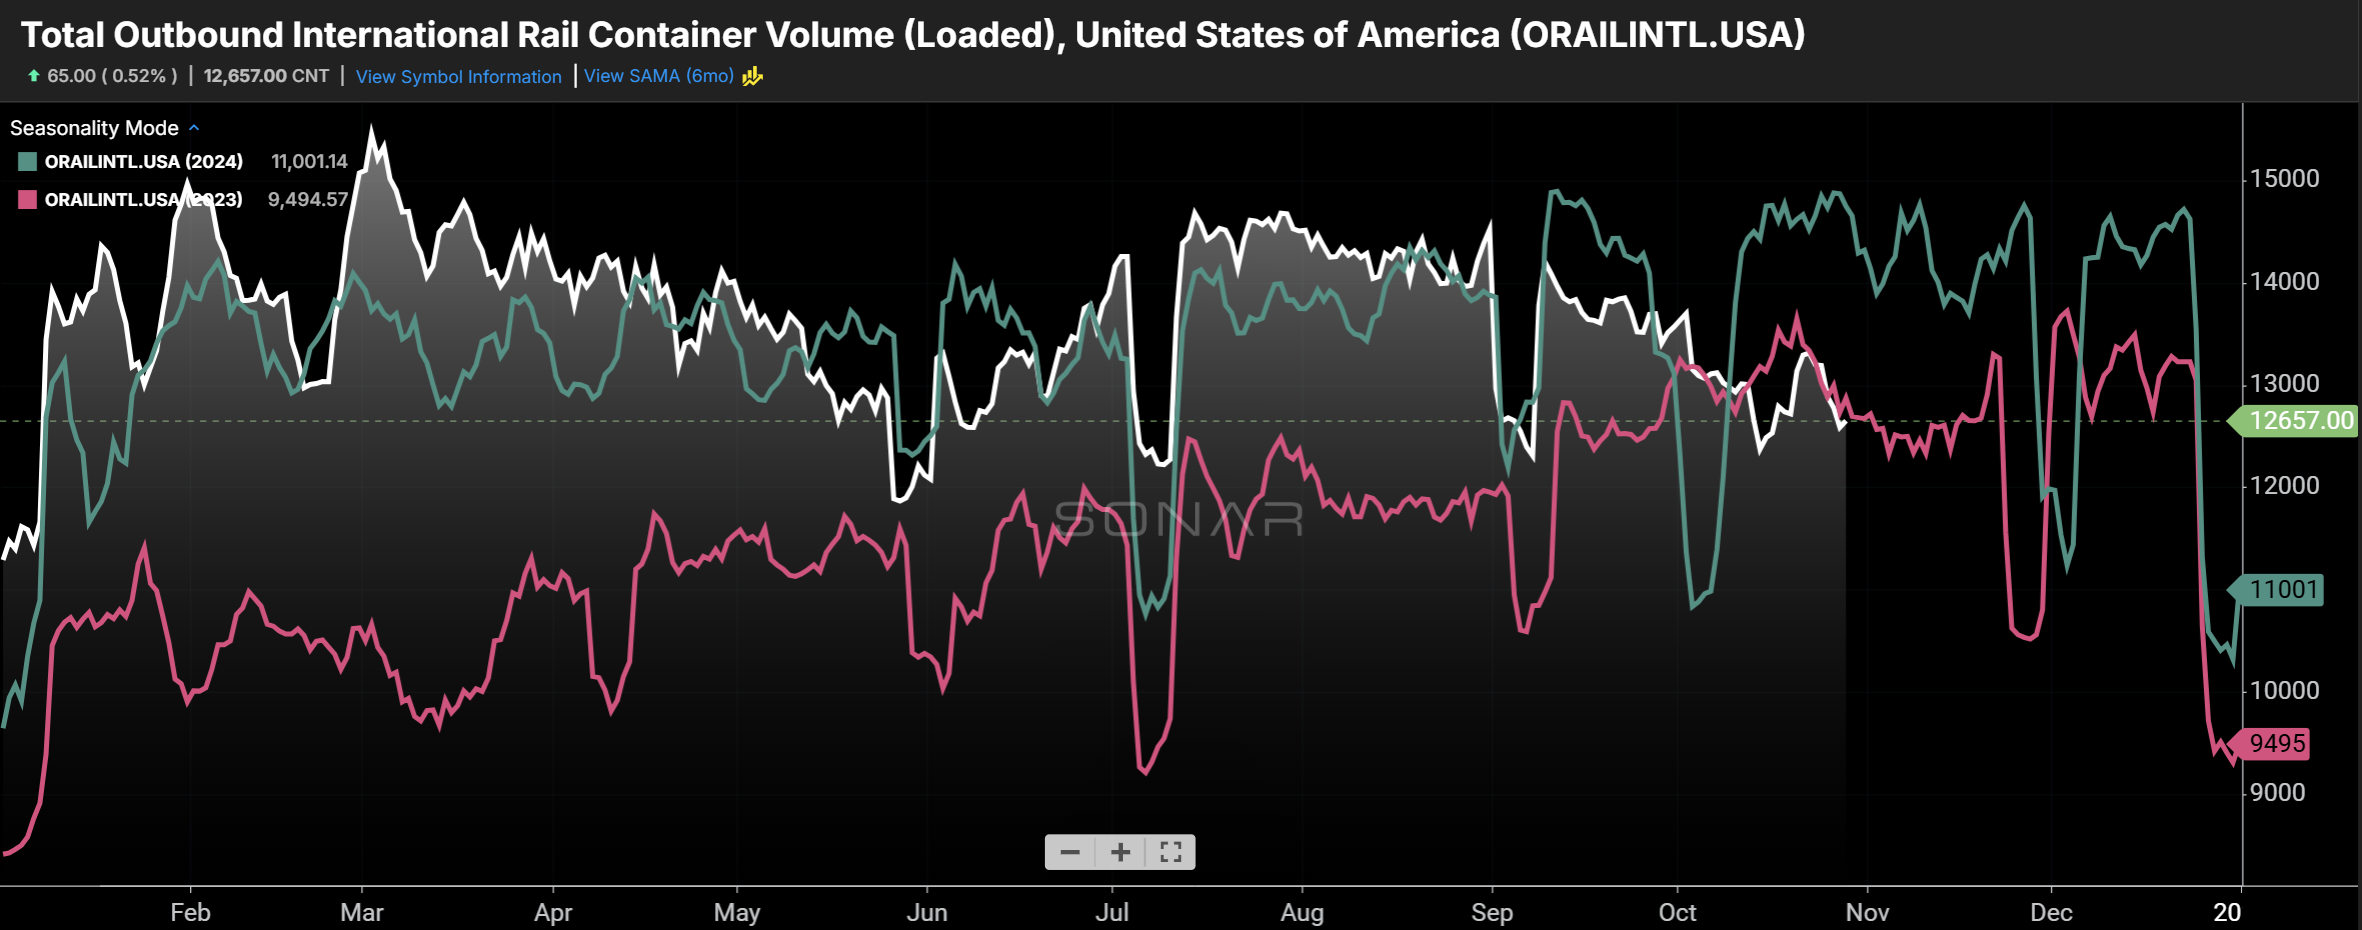
Loaded international intermodal volume in 2023, 2024, and 2025 in pink, blue, and white, respectively. (Chart: SONAR)
International intermodal volume (40’ and 20’ containers) moves closely with import volume, while domestic intermodal volume (53’ containers, which includes imports transloaded from ocean containers) is impacted fairly little by import volume. The railroads have guided analysts to expect a weak fourth quarter for international intermodal volume based on import expectations.
Loaded international intermodal volume in the Chicago to Seattle lane has been light this fall, presumably due to a lack of soybeans. (Chart: SONAR)
The Trump Administration promises that a trade deal will be beneficial to soybean farmers. A portion of soybean export volume moves in international intermodal containers headed from the Midwest to the Pacific Northwest that would otherwise be respositioned empty to the West Coast. That shows up in SONAR lane-level intermodal data, such as in the above chart.
Long-haul trucking supply and demand from port cities
Long-haul (> 800-mile) tender volumes (white) and tender rejection rates (red) outbound from Los Angeles. (Chart: SONAR)
The Los Angeles truckload market has been volatile this year, with tender rejection rates as low as 2% and as high as 12.5%. Tender volumes, meanwhile, have largely been depressed, as our data shows share loss to rail intermodal, though volumes have picked up as of late.
SONAR Container Atlas shows that the average transit time from China to the Port of LA is 14 days, and the average lead time (between booking and departure) is 16 days. Therefore, if a trade deal resulted in a surge in bookings, the West Coast ports will likely see that volume in about 4 weeks, with East Coast ports to follow about two weeks later.

