This week, SONAR announced the launch of a new data set to track truckload tenders and rejections! It’s a more comprehensive version of our truckload tender dataset. These metrics measure truckload demand, capacity, and lead times using electronic requests from shippers seeking capacity from their providers.
Quick facts on the new dataset:
- It’s approximately twice the size of our original 2019 tender data
- It includes a more diverse shipper mix with stronger representation from refrigerated freight and Food & Beverage/CPG sectors
- “S” data sets provide improved regional coverage and density across the U.S. and into select Canadian markets
- The new data continues with the same mission as OTVI, OTRI, OTLT, and OTMS, now with deeper market insight
Indices begin April 1, 2019 and use a national base index of 10,000 for volumes. Available at National, Regional, State, and Market levels.
New indices now available:
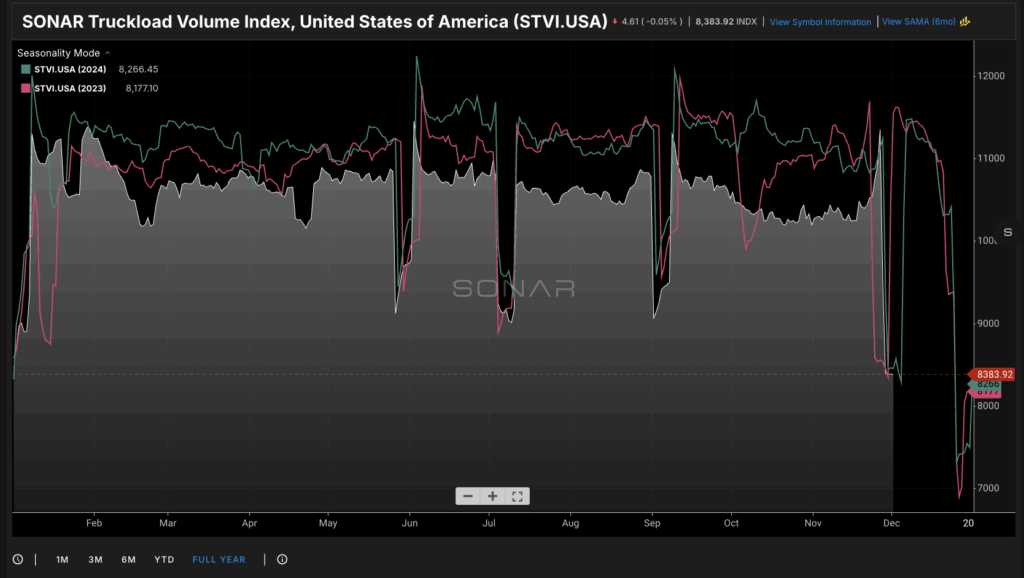
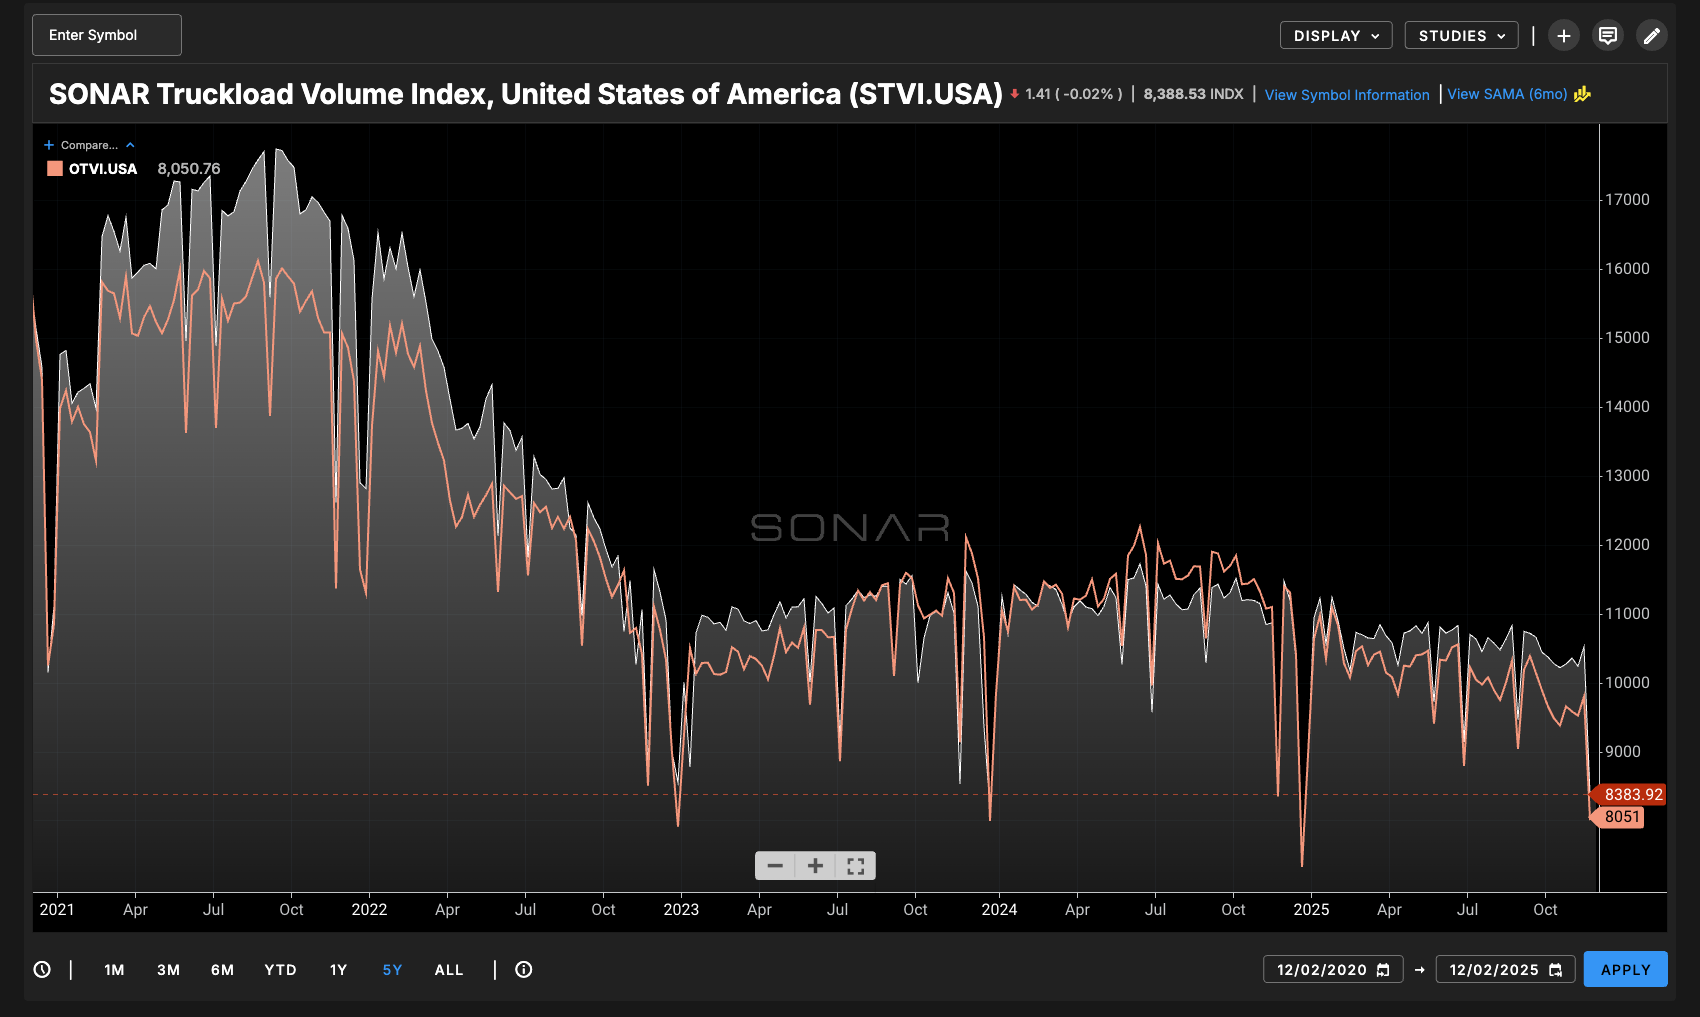
- SONAR Truckload Volume Index (STVI)
- SONAR Truckload Volume Index – Van (STVIV)
- SONAR Truckload Volume Index – Reefer (STVIR)
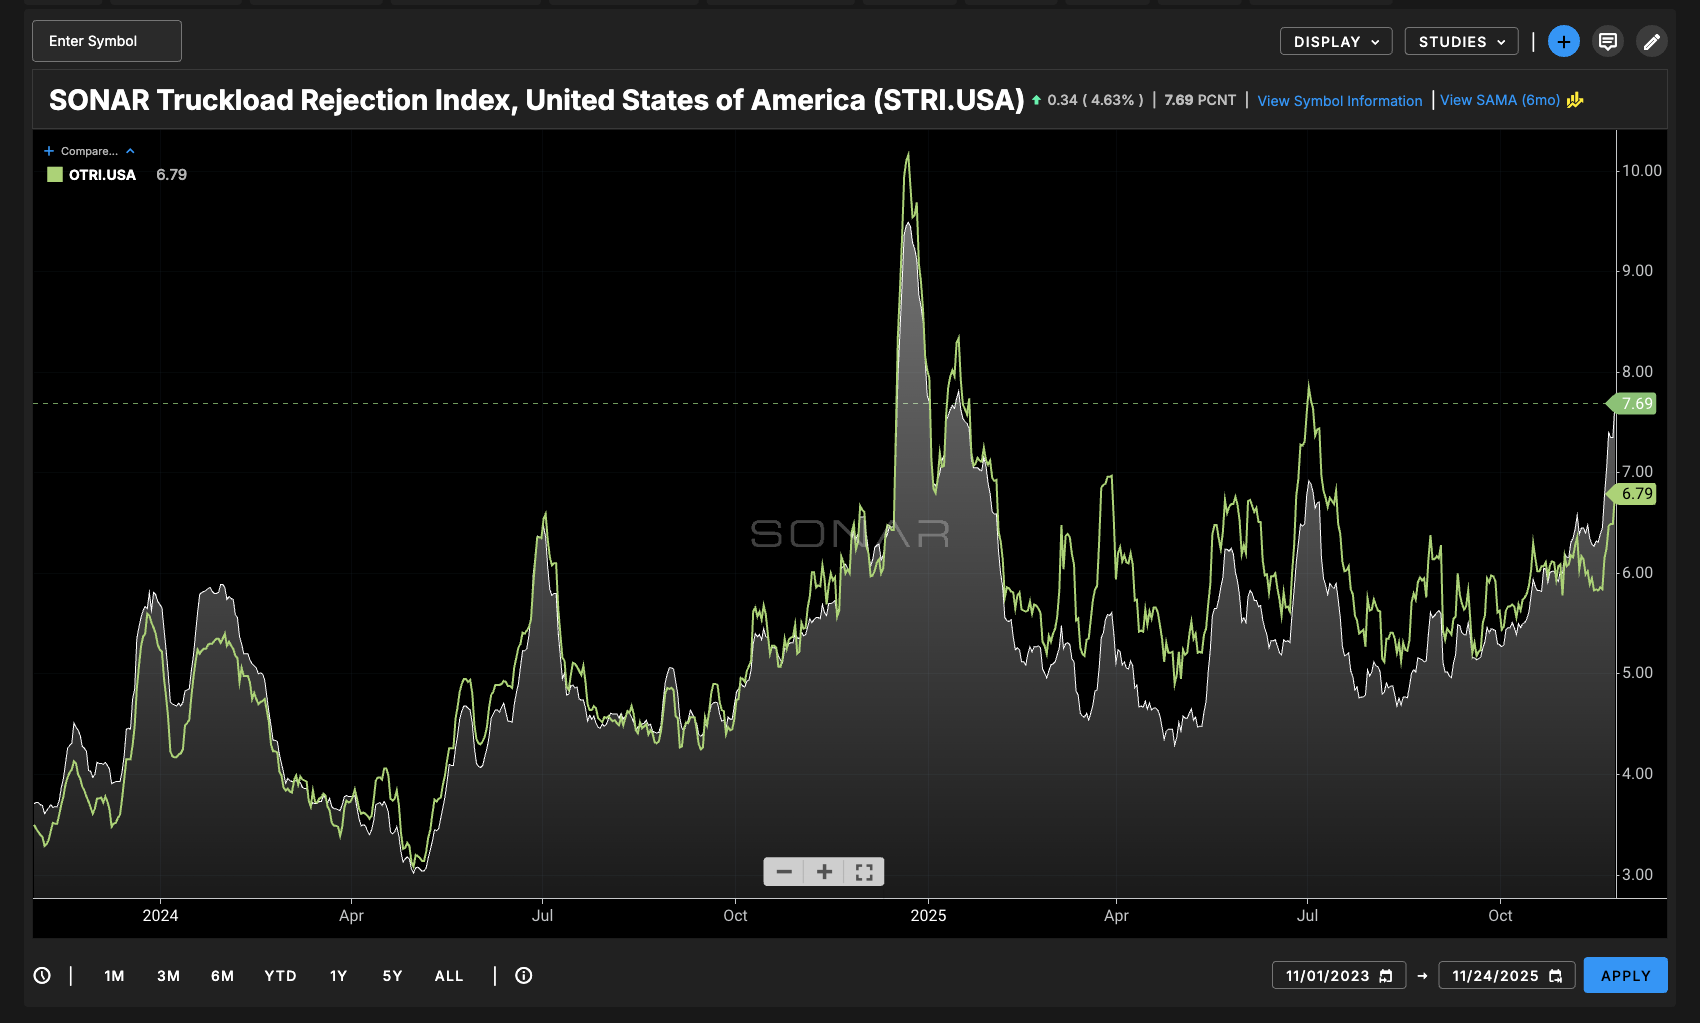
- SONAR Truckload Rejection Index (STRI)
- SONAR Truckload Rejection Index – Van(STRIV)
- SONAR Truckload Rejection Index – Reefer (STRIR)
- SONAR Truckload Rejection Index – Flatbed (STRIF)
- SONAR Tender Market Share (STMS)
- SONAR Tender Lead Time (STLT)
- SONAR Tender Lead Time – Van (STLTV)
- SONAR Tender Lead Time – Reefer (STLTR)
- SONAR Tender Lead Time – Flatbed (STLTF)
Quick Comparisons:
STRI vs OTRI (Truckload Rejection Index)
STVI vs OTVI (Truckload Volume Index)
STRIV vs VOTRI (Van Truckload Rejection Index)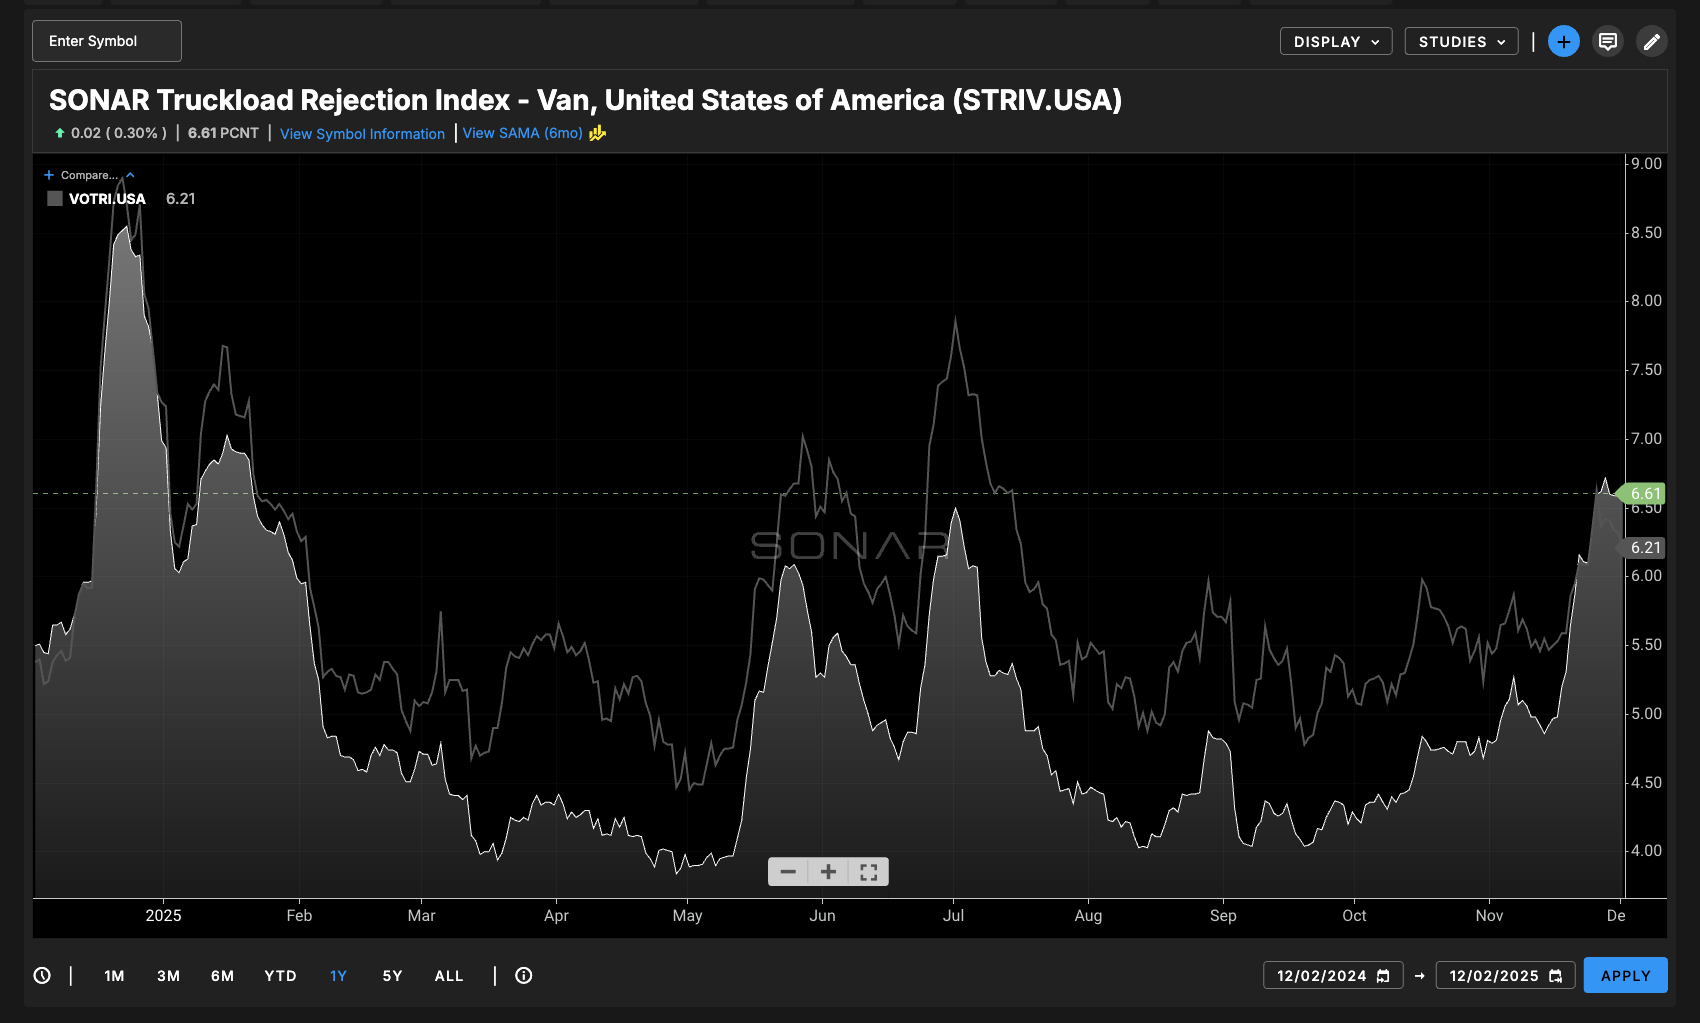
STIRR vs ROTRI (Refrigerated Truckload Rejection Index)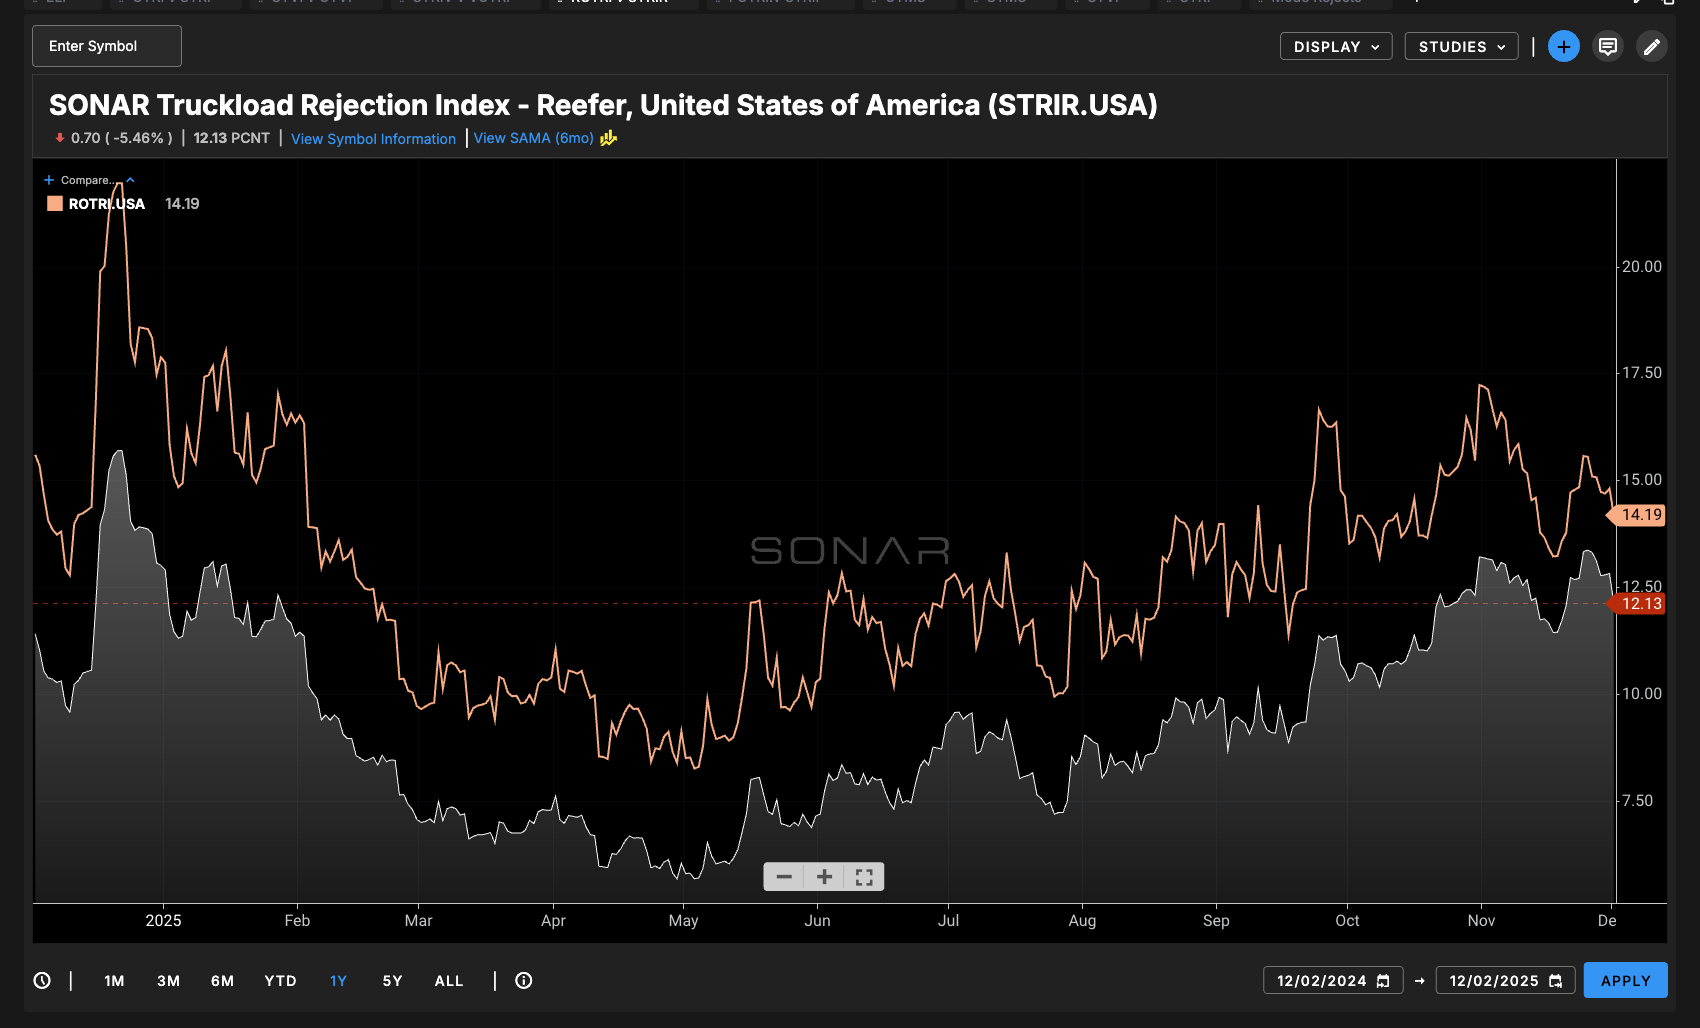
STRIF vs FOTRI (Flatbed Truckload Rejection Index)

Current SONAR Users can compare and explore the new indices here by clicking the link to this custom page.
Additionally, SONAR rolled out a new Air and Ocean Dashboard!
Ocean and Air Rates Dashboard
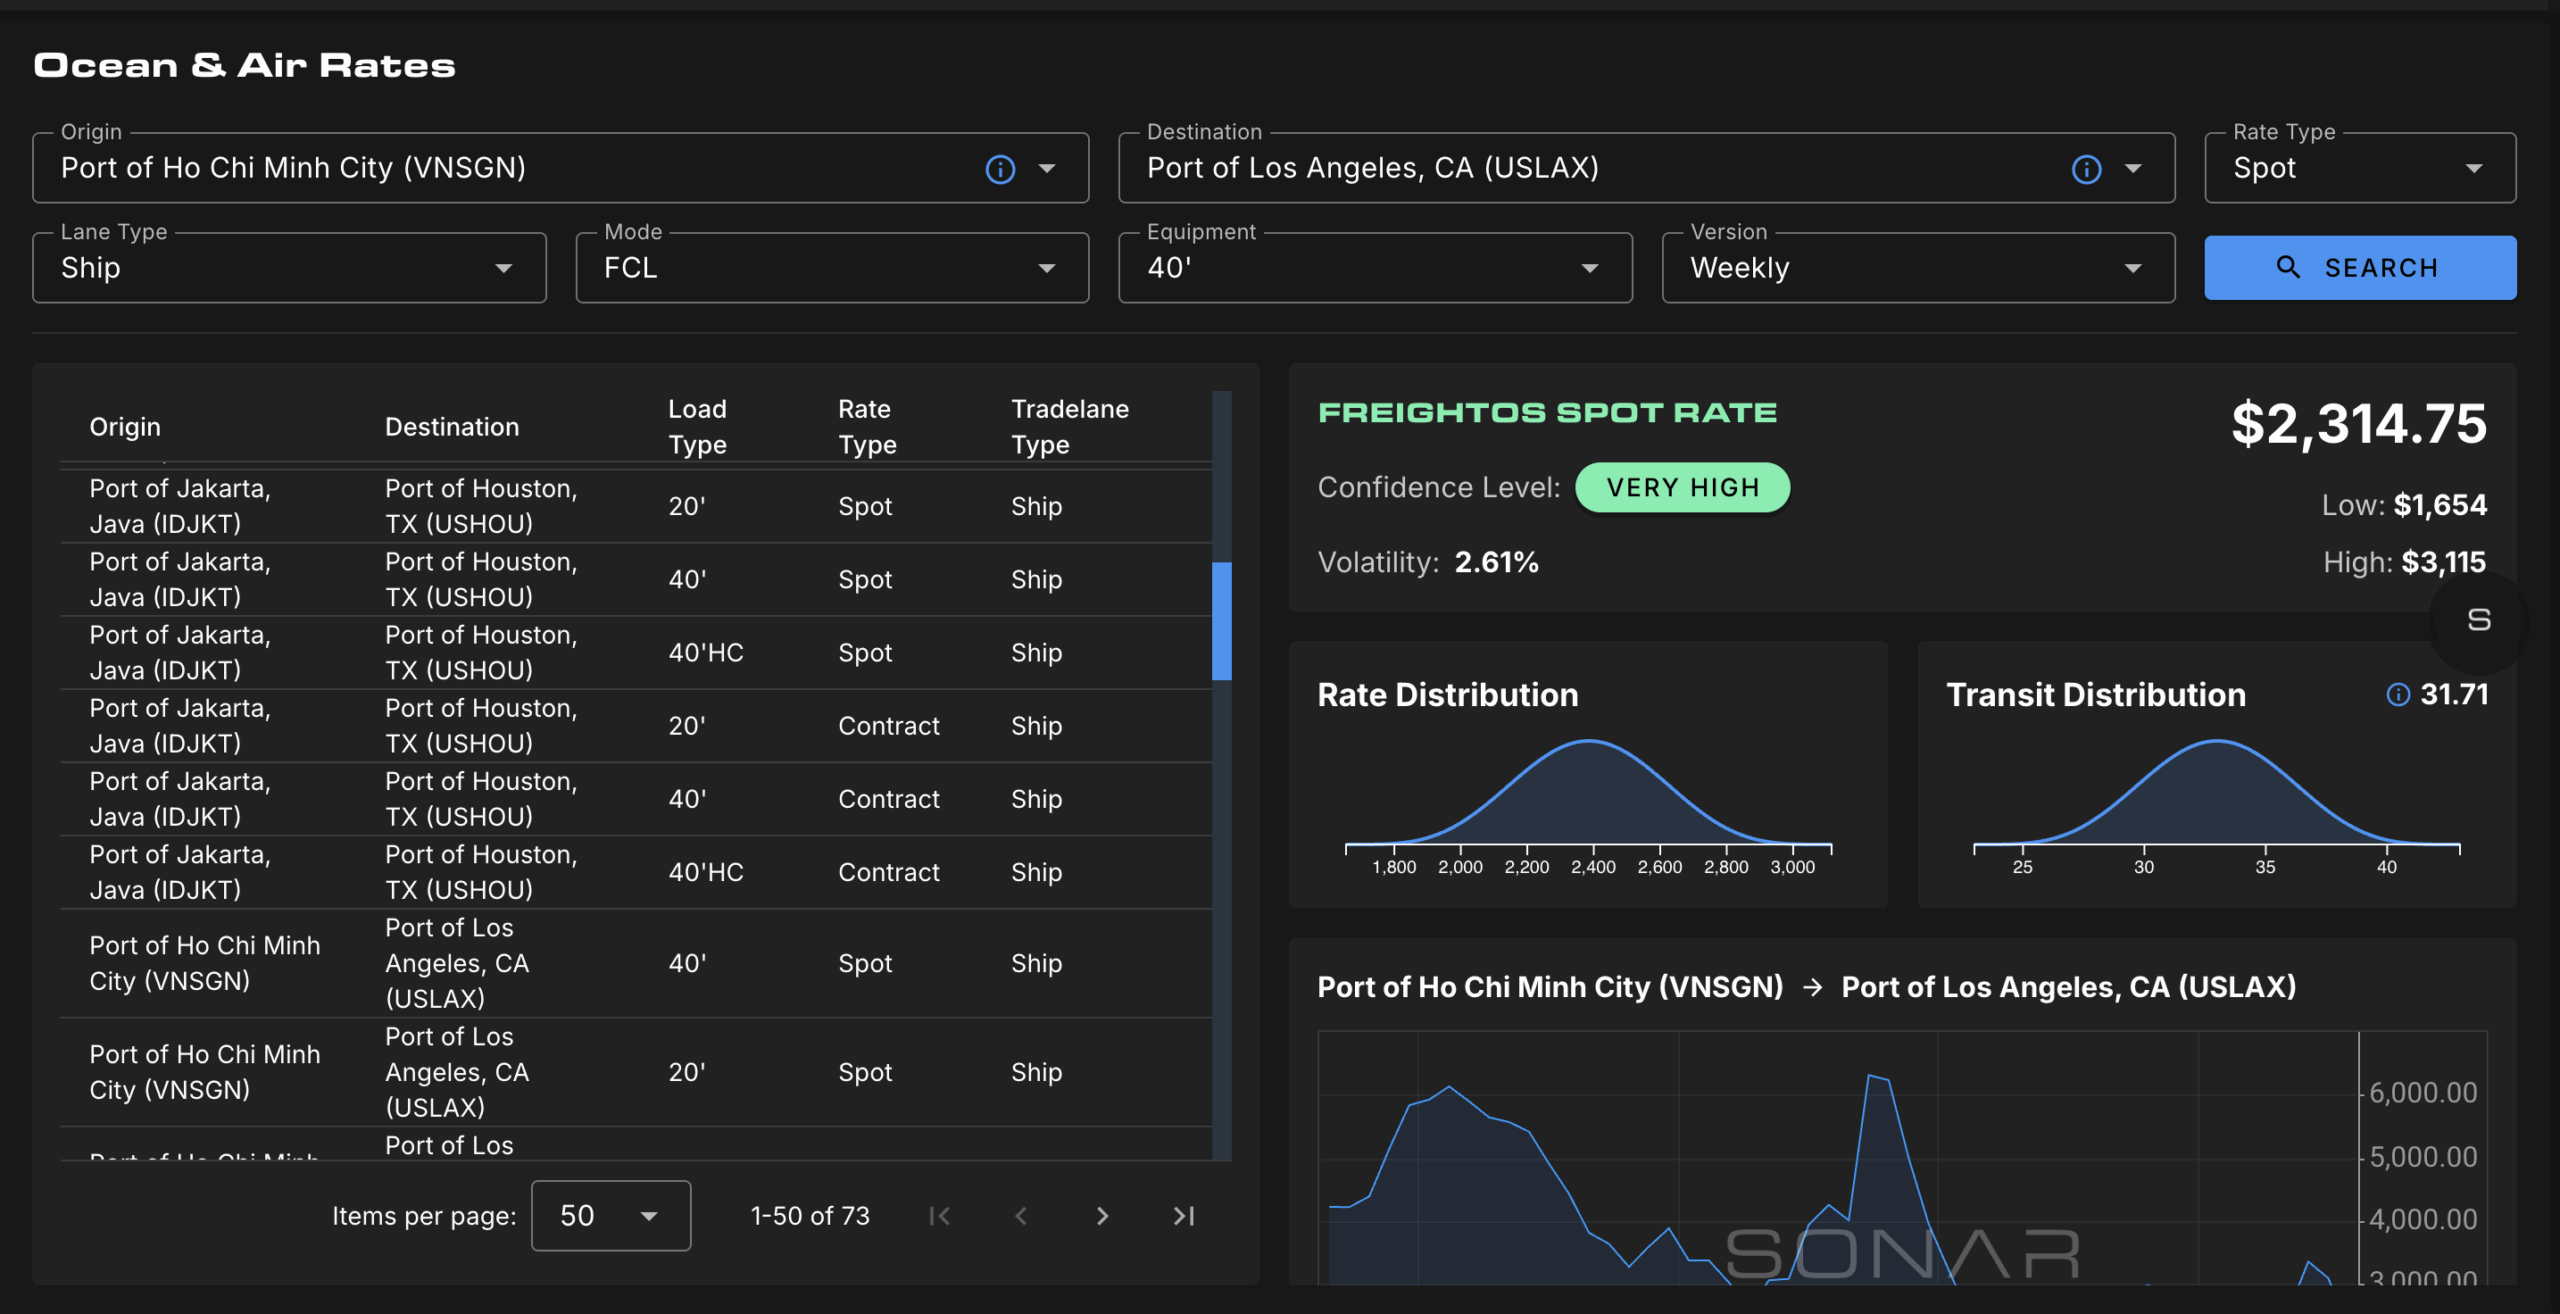
Our new dashboard brings daily global ocean and air rate visibility directly into SONAR. Users can:
- View benchmark spot rates and transit-time trends across key global lanes
- Compare pricing across routes
- Track rate changes over time to support sourcing, budgeting, and negotiation decisions
This dashboard provides reliable, lane-level pricing giving customers a trustworthy view of global freight trade conditions.
Both new features are live now! If you have questions or would like your access enabled for Ocean and Air, please contact your SONAR Account Manager or [email protected] to learn more. If you’d like to request a demo, click here.