


Photo credit: Jim Allen
How we use data to better plan for produce season is essential in optimizing produce season planning. Produce is a small portion of the volume of freight in the United States, but it can be one of the most disruptive forces in the industry.
Brokers and produce shippers are well aware of the typical timing of these disruptions, but oftentimes a shipper can be blindsided by massive variations in tender rejections and linehaul rate movements. This is where how we use data to better plan for produce season becomes crucial.
How we use data to better plan for produce season is necessary as produce markets are so disruptive due to their volume throughout much of the rest of the year. Since many of these markets are more agricultural in nature, they are relatively quiet from a volume perspective.
This pulls the capacity from not only those direct markets but surrounding areas as well. How we use data to better plan for produce season helps in anticipating these disruptions and preparing for the challenges ahead.
Produce seasons peak across the country, happen quickly, and rarely start at the exact same time each year. How we use data to better plan for produce season becomes a strategic advantage, enabling businesses to monitor tender data at the market level and respond proactively.
This is where being able to monitor tender data at the market level can become your secret superpower.
Optimize Produce Season Planning: Managing Disruptions and Market Fluctuations
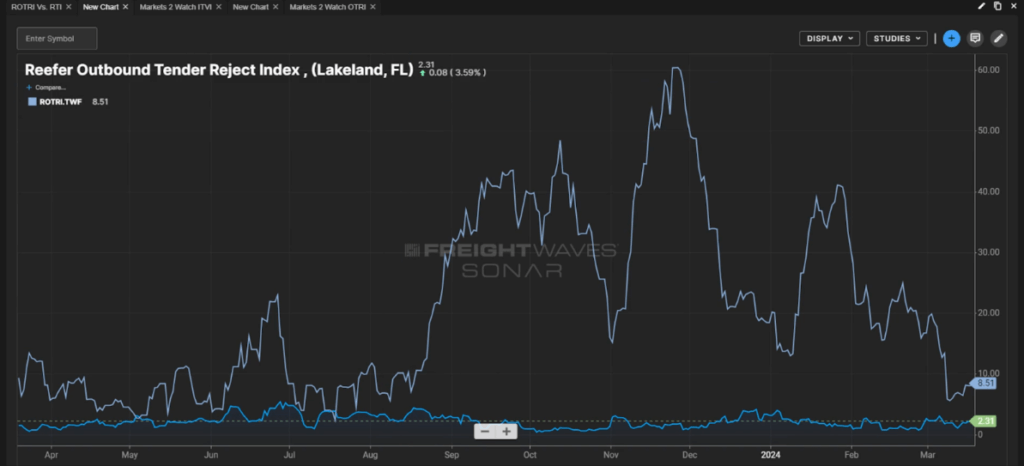
For example, take the market of Twin Falls, Idaho in comparison to Lakeland, Florida. Both markets see decent amounts of produce, but only one sees the wide swings in freight rejection volatility due to disparities in capacity.
How we use data to better plan for produce season uncovers this volatility and provides greater visibility into volumes and supply/demand metrics where seasonal impacts will make an impact.
Since many of these markets are more agricultural in nature, they are relatively quiet from a volume perspective.
This pulls the capacity from not only those direct markets but surrounding areas as well. Optimize produce season planning helps in anticipating these disruptions.
Produce seasons peak across the country, happen quickly, and rarely start at the exact same time each year.
This is where being able to monitor tender data at the market level can become your secret superpower.

Take, for example, the market of Twin Falls, Idaho in comparison to Lakeland, Florida. Both markets see decent amounts of produce, but only one sees the wide swings in freight rejection volatility due to disparities in capacity.
Companies have leaned on historical data and load board rates for years to manage produce seasons. However, how we use data to better plan for produce season shows that the first and last 48 hours of a produce season are some of the most critical. Knowing volatility, capacity trends, external volume context, and more gives users a strategic advantage and uncovers pockets of opportunity when the rest of the freight world will be left guessing.
Effective how we use data to better plan for produce season involves leveraging this data to stay ahead. Only SONAR provides truly proactive supply chain data with context for smarter transportation decision-making.
Tender data uniquely uncovers greater visibility into volumes and supply/demand metrics where seasonal impacts will make an impact.
Additionally, SONAR freight data offers bulk lane analysis in a variety of ways for users to understand drastic changes in rates, volumes, rejection data and more on a week-over-week or month-over-month basis.
This can be seen in a list or map view form. Users of SONAR are then able to use the most up-to-date market data to react with pricing and capacity strategies faster to strengthen negotiations, compliance and relationships.
Companies have leaned on historical data and load board rates for years to manage produce seasons. In reality, the first and last 48 hours of a produce season are some of the most critical.
Knowing volatility, capacity trends, external volume context, and more gives users a strategic advantage and uncovers pockets of opportunity when the rest of the freight world will be left guessing.
Effective optimize produce season planning involves leveraging this data to stay ahead.
Only SONAR has truly proactive supply chain data with context for smarter transportation decision making.
By partnering with hundreds of technology players and aggregating more than $1.7 trillion in annual global supply chain data, SONAR is more effective in both broad and pinpoint logistics applications. Whether it is pricing one load or benchmarking a billion-dollar supply chain, how we use data to better plan for produce season ensures more accuracy and confidence.
Optimize produce season planning is critical for navigating the volatility that produce markets introduce to the freight industry. The sheer disruption caused by seasonal peaks can create significant challenges in capacity and rate management. How we use data to better plan for produce season involves using advanced data analytics to predict and prepare for these market shifts.
Optimize produce season planning is critical for navigating the volatility that produce markets introduce to the freight industry. The sheer disruption caused by seasonal peaks can create significant challenges in capacity and rate management.
Optimize produce season planning involves using advanced data analytics to predict and prepare for these market shifts. By leveraging SONAR’s detailed tender data and freight analytics, shippers and brokers can gain unparalleled insights into seasonal trends and capacity fluctuations.
This proactive approach allows for more strategic planning, enabling businesses to anticipate and mitigate the impacts of produce season disruptions effectively.
Take a look at our on-demand webinar to hear our market experts break down the complexities of produce season. Follow us on LinkedIn and Twitter to stay up to date with upcoming webinars!
To see how other organizations are implimenting SONAR, check out case studies here.