


How can SONAR help me?
To help you make the most out of SONAR, FreightWaves’ Market Experts have compiled thorough Use Case examples, designed to walk you through the indices, features, and data sets that we turn to day in and day out. Have questions? Visit the Knowledge Center or contact [email protected]
A Guide to Rates: Spot vs Contract
Understanding the difference between spot rates and contract rates is crucial for shippers, brokers, 3PLs and carriers. This guide delves into the intricacies of these two types of rates, their impacts on the freight market, and how they can be leveraged for optimal performance.
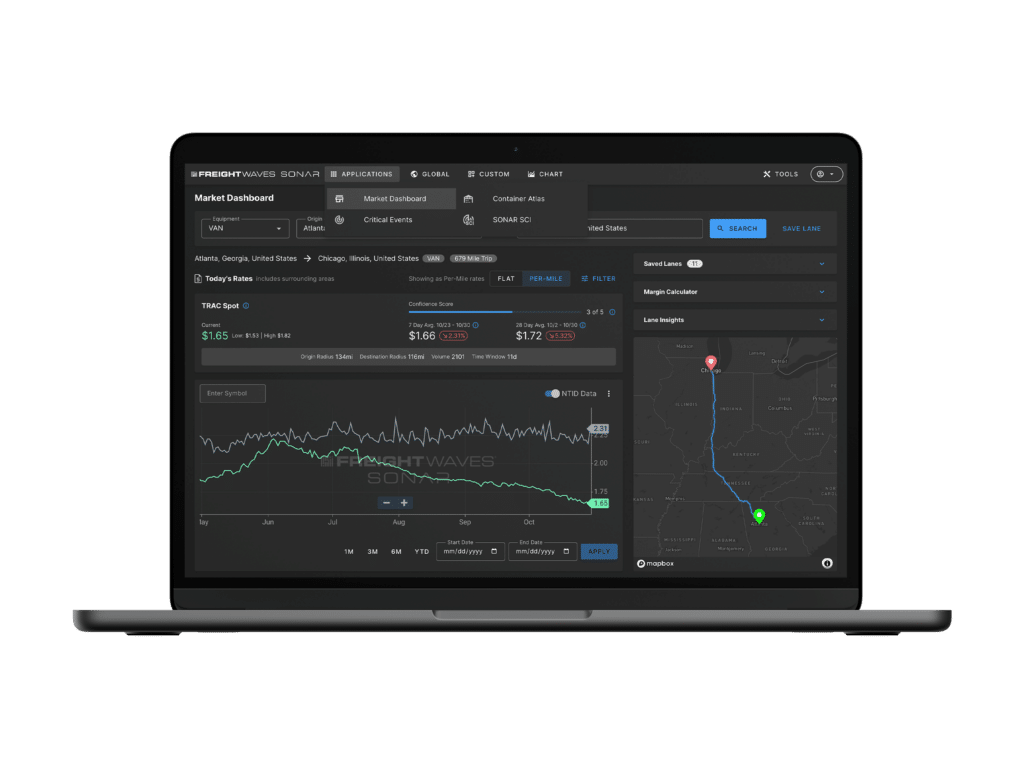
Improve Asset Utilization with SONAR Market Dashboard
In order to earn a positive return on capital, carriers have to avoid hauling loads for free. That requires pricing their headhaul loads high enough to compensate for the probability of having to accept low-rated brokered loads on backhauls.
Target Sales and Pricing Discipline for Brokers
By targeting the sales efforts of asset-based account executives or freight brokers, SONAR customers’ sales teams are able to utilize their valuable time by targeting the areas that are experiencing an increase in demand and tightening of capacity.
Understanding Rates and Tender Data
The US truckload market can generally be measured by looking at both contract and spot market activity. Carriers are mainly judged by their rates and service, which means these are the two most important data points to use to measure the market. Taking a top-down approach using both data points can allow you to increase the odds of expanding margins or hedge your exposure to swings in market conditions.
Ocean Data for Global Logistics Optimization
The Container Atlas application in SONAR illustrates supply and demand in the ocean market by showing spot rates in addition to numerous other supply and demand metrics outside of rates, such as bookings information.
Unlock Leading Indicators for Drayage Demand
While SONAR doesn’t contain drayage rates yet, certain data sets provide a look forward at demand that can help carriers be nimble with timely adjustments to resource levels. Total drayage capacity in a particular market doesn’t typically change much from day to day or week to week, but demand can fluctuate based on the volume of containers coming off the docks or into a rail yard.
Understanding the Freight Cycle
The Waterfall Theory of Freight illustrates the critical importance of maintaining high routing guide compliance to control shipping costs and what might happen if these routing guides fall apart. Tools like SONAR enable transportation providers to track tender volumes, rejections and market imbalances, providing valuable insights into freight trends. By leveraging these tools, SONAR users can better navigate the complexities of freight logistics, ensuring more efficient and cost-effective operations.
Take control of your supply chain
Get access to the leading global supply chain freight market intelligence platform. All subscriptions come with access to support from our Army of Experts.