There are three primary types of trailers used in trucking – dry vans, flatbeds and refrigerated trailers, known generally as “reefers.” The volume of reefer trailers continues to sway in response to the COVID-19 pandemic. FleetOwner magazine explained, “spot truckload volumes rose 12% for reefers month-over-month, while flatbed load counts added 9%. Compared to March 2019, volumes increased 17% for both van and reefer equipment, while flatbed volume edged up only 2%. As averages, these percentages are considerably higher than a typical March but were tamped down by the drop-off in activity late in the month.” Even as August rolls forward, reefer rates have yet to recover fully. Of course, exceptions exist, and making the most of that knowledge – seeing the market’s actual trends – is key to understanding how freight data can accurately predict reefer rates and keep freight spend under control.
There’s an argument that predicting reefer rates is not necessary. Why? When refrigerated trailers are used, goods that are necessities (food, produce, beverages and other items that must be maintained at certain temperatures), and regardless of what the costs rise to, companies will pay them. However, the COVID-19 pandemic shook up the industry. As people took to grocery stores to restore control over one part of their lives and prepared for a long-haul in an uncertain economy, store shelves grew barren. In turn, demand for reefer transport went through the proverbial roof. It’s a grand irony. Reefer rates have fallen, but they continue to rise in areas where capacity remains tight.
Why is that important? Think about it. If the overall rates look promising, a 400% increase in a local reefer transport or moving product between a distribution center and nearby retailers may cost significantly more than merely moving freight through dry vans if the conditions are appropriate. It’s all about getting the right mix of dry van and reefers to cut costs when reefer freight risks are acceptable. So, how can a company know whether those risks will have a return?
They need the ability to predict reefer rates based on all the data. And as the market moves forward, no one is certain of what will happen. The one sure thing is this: e-commerce is experiencing a boom. That’s driving the industry forward. Resources are finite, and the capacity crunch is back in play.

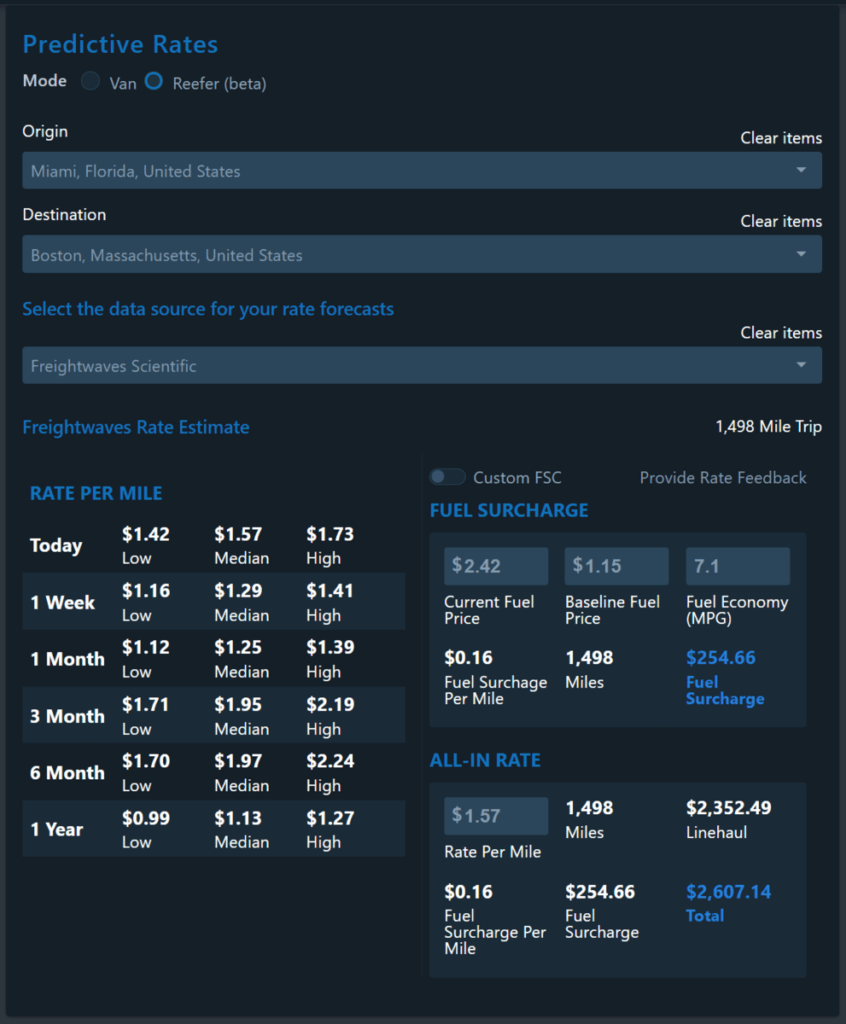
Like all freight rate algorithms, there is a margin of error. Not every system can analyze all past data, so more companies are turning to proven solutions that have a record of forecasting the most accurate models in the industry. FreightWaves already possesses the data and connected systems as part of its innovative SONAR freight forecasting and analytics platform. Applying that data in reefer transport allows for proactive management of lane selection, consideration of seasonal effects and the review of other data – such as equipment necessary – to create the most accurate depiction of reefer rates for all shipments.
Fuel surcharges, accessorials, detention fees, late assessments, and other charges quickly add to total freight spend. Without knowing the exact rules and regulations governing every shipment, every lane, every company policy, and every supply chain partner preference, there will always be some uncertainty. However, merely knowing that uncertainty remains provides a way to circumnavigate the use and think strategically.
For example, SONAR tracks routing guide compliance metrics by reviewing total tender rejections and data sets surrounding more than $200 billion of activities and freight under management (FUM). SONAR subscribers can compare the scope of data across brokers, forwarders, refrigerated carriers and shippers to existing load boards, market insights and historical trends. They can then better consider how costs may swing in weeks, months or even full seasons. Users can further refine the cost expectation by adjusting the line-haul calculation within SONAR by increasing fuel surcharges. In turn, cascading charges – such as higher line-haul costs and surcharges may lead to additional charges with Carrier B, while Carrier C sees a lower rate. As a result, users can avoid surprises, and better plan for refrigerated transport’s total landed cost.
Because moving fresh food, pharmaceuticals, beverages, etc. via reefer is more expensive than dry vans, understanding all shipments’ full cost is no longer a “nice to have” option in modern supply chains. It’s a necessity. Those that put the power of SONAR’s freight data forecasting tools to work can successfully predict reefer rates and other rates as appropriate. Find out how your organization can reap those benefits by requesting a SONAR demo online today.