Freight market conditions shift by the day—and often, by the hour. Whether you’re managing procurement, operations, or risk, the need for timely, precise data has never been greater. That’s why SONAR’s latest release is a game-changer for anyone needing hyper-targeted freight insights.
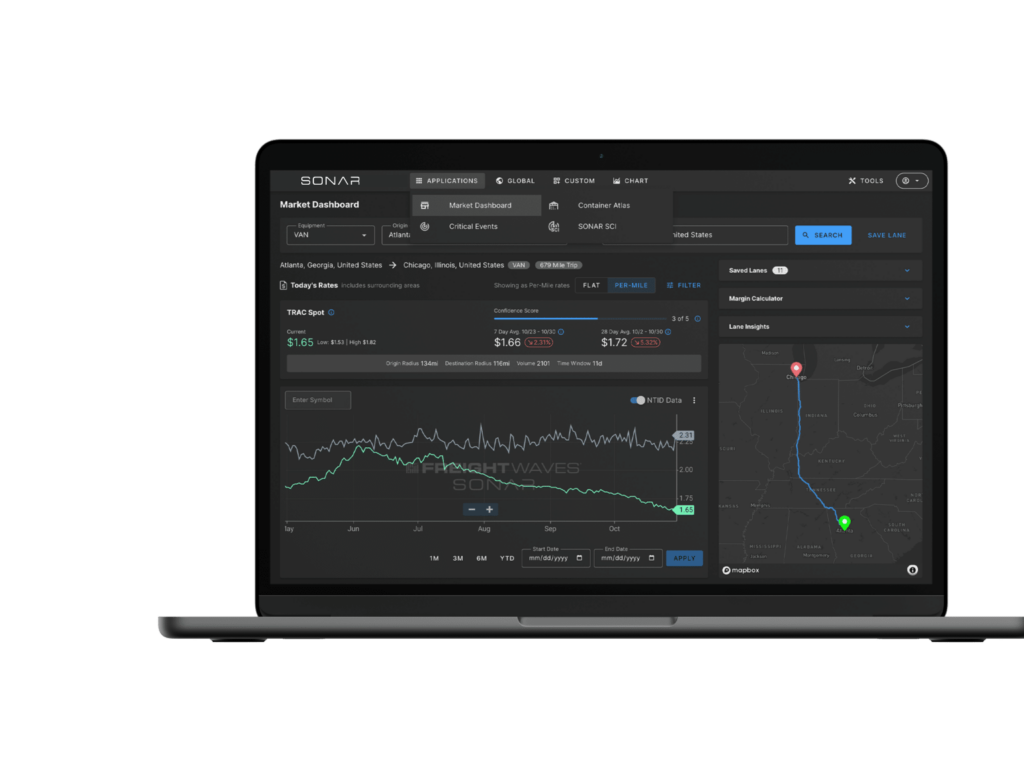
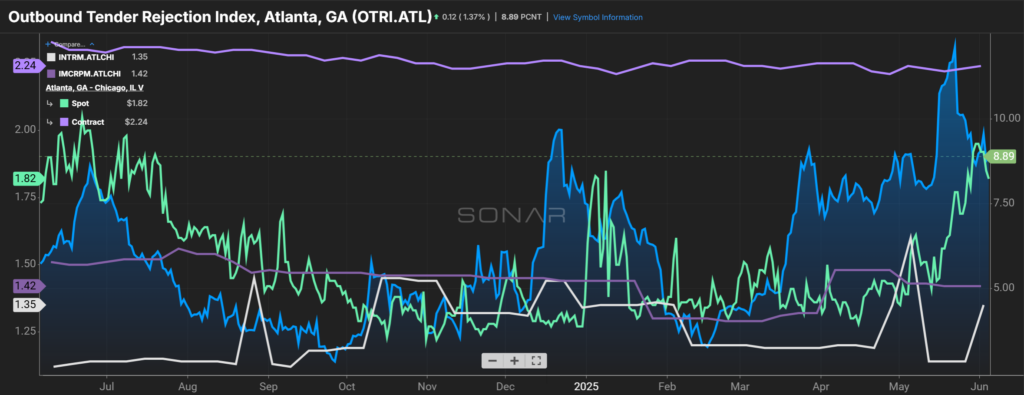
With the new updates, SONAR now offers lane-level rate visibility across all chart types, making it easier than ever to hone in on the exact market conditions that matter most to your business. Whether you’re analyzing trends, adjusting strategy, or negotiating contracts, you can now visualize rates and capacity for specific lanes with just a few clicks.

Zoom In on the Lanes That Matter
Forget generalizations. SONAR’s latest chart enhancements put the spotlight directly on origin-destination lanes, helping users:
-
Pinpoint rate fluctuations on high-volume lanes
-
Compare capacity conditions across regional corridors
-
Monitor market volatility with real-time data in every chart view
This granularity empowers shippers, brokers, and carriers alike to respond with precision—allocating resources where they’re needed and staying ahead of price swings.

Smarter Charts, Deeper Context
With this update, SONAR has also made charts more intuitive. Chart titles now automatically reflect the View Symbol, helping you immediately understand what data you’re analyzing. No more second-guessing what a chart represents—just clean, confident decision-making.
Plus, from inside the Trade War Command Center, you can now use the new “View on Chart” feature to deep-dive into visualizations straight from the dashboard’s bottom charts. Whether you’re tracking import surges or disruptions from global tariffs, the added functionality gives you the power to turn headlines into data-backed action.

Capacity Conditions Meet Rate Trends
This isn’t just about rates. With Truckload National Insights, users can now sort the Weekly Top Moving Markets table to identify where capacity is tightening or loosening, and then pair that with corresponding rate data. It’s an invaluable edge for anyone trying to balance cost and service levels in a volatile market.
Ready to Explore Lane-Level Intelligence?
These updates make SONAR not just a freight data platform—but a true decision support system. To learn more or get help activating these new features, reach out to our Customer Success team at [email protected] or request a demo.
Stay tuned. This is just the beginning of what SONAR can do at the lane level.