It’s another week and the SONAR team is ready with another “SONAR Indices & Insights.” Each week, you’ll learn about another index found within SONAR, the freight forecasting platform from FreightWaves. This week we’ll focus on the “Tender Market Share” index.
In the image above of the Outbound Tender Market Share (OTMS), it shows that over a one-year period, demand for trucks has grown in several markets in the Midwest and Northeast, causing increases in these markets’ national outbound tender market share. Some of the larger markets – Atlanta, Houston and Ontario – have seen their market shares decline.
The Tender Market Share is a relative index that measures the number of tendered loads in individual markets in relation to total tendered load volume for the day in the U.S. The sum of all the markets equals 100.
Example: OTMS.ATL = 4.58 means the Atlanta market originated 4.58% of all U.S. tendered loads that day.
Market share percentages tell you what markets have the most impact on truck volumes. A larger market share means the market demands more trucks and has a larger impact on freight market capacity. When market share levels change, network imbalances can occur, creating potential spot market activity.
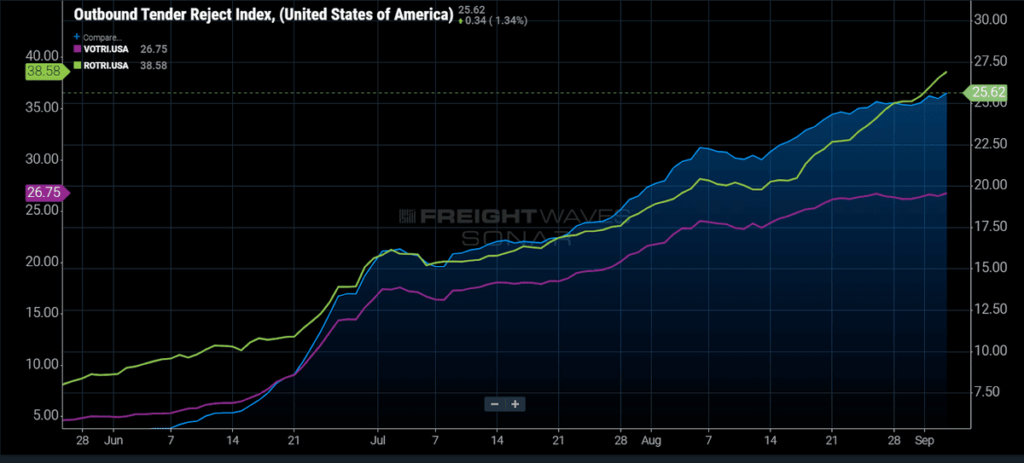
Capacity remains tight across the nation for shippers, causing spot rates to climb, and pushing outbound tender rejection rates higher each week. The average outbound rejection rate in the U.S. has risen to 25.62%, with refrigerated equipment well above that average at 38.58%.
The DHL Pricing Power Index held at 85 this week, indicating carriers still have the strength in negotiating power over shippers. Spot rates have increased over 30% year-over-year, forcing shippers to pay much higher rates this year for on-demand capacity when their loads are rejected by their contract carriers. With demand for trucks so high, and the retail/holiday season approaching, capacity should remain tight through the end of the year, and carrier rates for on-demand capacity are very likely to continue to increase throughout that period. Shippers need to work with their contracted carriers on capacity and rate issues to keep their carriers hauling their freight and reducing spot market exposure.

The Outbound Tender Volume Index (OTVI) climbed another 1.4% last week to a new all-time high of 16,053. OTVI has posted a string of consecutive all-time highs for many weeks now. It is important to note that OTVI does include rejected contract load tenders, so the true organic growth of load volumes is significantly lower than the indexed reading as explained later. However, this does not mean the index is not directionally accurate or not indicative of the overall strength in the freight market. However, the rate of volume acceleration has begun to slow.
To account for the high level of rejected tenders in SONAR’s Outbound Tender Volume Index, a new metric, a proxy index for accepted tenders, has been calculated. Using this correction, volumes are running about 19% higher year-over-year and are at a three-year high. Carriers are rejecting one in four contracted load tenders, and spot rates have pushed north of $2.75 per mile on a national basis.
The extremely high level of tender rejections is distorting the true volume level. To account for that, one can use this simple formula to calculate the indexed level of accepted tenders as a proxy (note this is not the actual number of accepted tenders, which is proprietary): OTVI* (1-OTRI) for any given day. We also note that we chose to use last Thursday’s (September 3) readings to remove Labor Day-related distortions.
16,128* (1 – .25) = 12,096 accepted load proxy index for September 2, 2020
10,660* (1 – .046) = 10,127 accepted load proxy index for September 2, 2019
Using this metric to control for the high level of rejected tenders allows us to get a more accurate understanding of the true demand level. This does not mean demand is not at a historically high level – it is. With this metric, trucking volumes (van, reefer, flatbed) are running up over 19% year-over-year.

The demand throughput has carriers sitting comfortably rebidding or rejecting loads. OTRI at 25% indicates one in four contracted loads is being rejected across the country. This is historically an extremely high rate and is approaching the historical upper bound of the index. At this high a level of tender rejections, market dynamics can shift as pressure mounts to see contracted freight renegotiated at higher rates (thus leading to lower rejection rates).
