The rest of the year could be characterized by relatively low rates and volatility
Like it or not, freight market volatility is here to stay. The post-recession environment that filled our expectations with the concept of “normal” is in the distant past. Even before the COVID-19 pandemic era, the U.S. transportation sector was experiencing an increasing amount of disruption in the form of natural disasters, macro-economic shifts, and increasing geopolitical challenges impacting supply chains. Arguably, the extended period of stability may be to blame for the recent destabilization, which looks to be the “new normal” for the foreseeable future.
The loss of predictability
The domestic freight market was relatively stable after the Great Recession, which trended right in line with economic growth. That pattern changed in 2016 as the industrial economy hit a stumbling block after the oil markets collapsed but the economy. This led to a softening of the freight market as goods demand waned.
By late 2017, volumes had returned, spurred by a perfect storm of tax incentives, an unusually active spring produce harvest, and an active hurricane season. While overall demand was strong, it was not necessarily breaking records, but rates surged. Demand had grown rapidly after a period of extended softness. This pendulum swinging back and forth between extremes is what has characterized the past seven years.

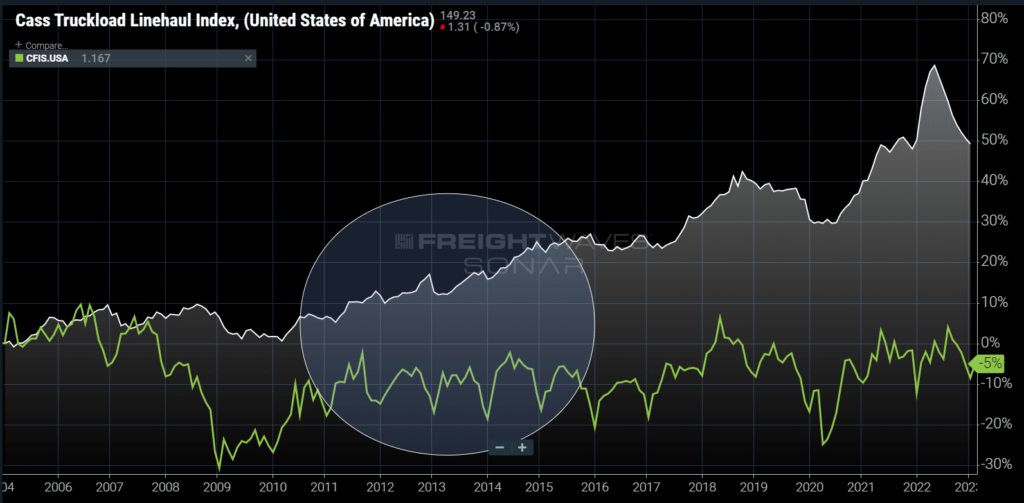
Trucking costs and volumes moved predictably from 2020 to 2016. (Chart: SONAR)
The Cass Truckload Linehaul Index measures the average cost of a truckload in the U.S. while the Cass Freight Shipments Index measures total domestic freight demand across multiple modes. From 2010 to late 2015, truckload costs increased in a stable predictable pattern of about 2%-3% per year. Freight shipping patterns were almost a heartbeat of seasonal predictability.
The 2016 market was much softer than the previous five years, leading to rate stagnation and a significant increase in carrier failures that bled capacity out of the space. The market cannot sustain too much excess capacity for long periods of time. Carriers need consistent freight volumes to maintain their networks. Strong shifts in demand cannot be handled.

Trucking demand has stabilized this spring. (Chart: SONAR)
As of April, truckload demand had stabilized at a significantly lower level than what characterized the pandemic era of overheated demand. The national Outbound Tender Volume Index (OTVI), which measures shipper requests for truckload capacity, was nearly 30% lower than the previous year.
The good news is that the OTVI stopped falling in February and actually increased 2% in March. The bad news is that the data suggests demand had dropped well below what carriers needed to maintain their operations with the available equipment.
This dramatic amount of oversupply suggests that the rest of the year will be characterized by relatively low rates and volatility. The biggest question is just how long will it take for capacity to fall more in line with demand? And secondly, how reliable is the current level of demand?
The second question is a discussion for an economist and infinitely more complicated to answer. So for now, let’s assume that this current demand level is sustainable for the rest of the year. Let’s explore the first question by looking at a combination of demand and capacity indicators, accepted tender volumes and tender rejection rates.

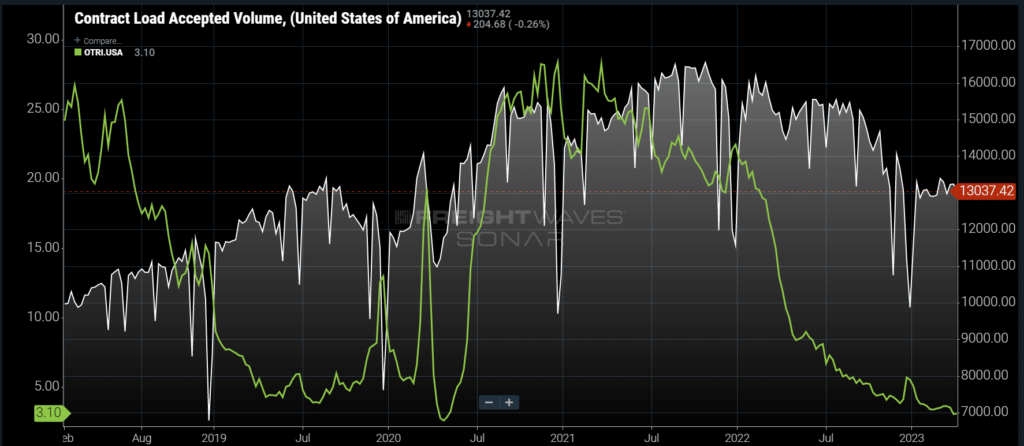
Carriers were handling 20%+ more freight in the fall of 2021. (Chart: SONAR)
Looking at the Contract Load Accepted Volume Index (CLAV), which measures accepted contract load tender volumes, carriers were moving approximately 20%-25% more freight at the end of 2021 than they were in early April this year. Rejection rates were above 20% at the same time, indicating that carriers were handling their limit with an overflow moving on the spot market.
With rejection rates under 3% on April 10, carriers appear to be moving everything they can under contract with an implied surplus. FMCSA data suggests aggregate capacity was still being added to the market through most of 2022. In other words, the data suggests there is a lot of excess availability in the for hire truckload market.
Historically speaking, the supply of capacity moves much more slowly than the demand side dynamics, inching up or down around 1%-2% per month at most. Applying this logic, it will be 2024 before there is a chance for capacity to tighten meaningfully and carrier positions to stabilize.
While this may seem OK to most, the increasing amount of volatility and sharpening demand shifts make the transportation market more disruptive to supply chains, whereas the market can impact the health of the overall economy versus just being absorbed as seasonal inefficiency.
Just like when warmer temperatures lead to more violent storms, overheated economics lead to more violent ups and downs. The next year will most definitely be a down for most transportation providers, but it is also setting the stage for another violent upswing.
Interested in learning how you can use FreightWaves SONAR’s pricing and high-frequency freight market data for your business? Sign up for a SONAR demo.


