Rejection rates drop the most in the biggest markets
This week’s SONAR Pricing Power Index (PPI): 50 – As capacity begins its return to the freight market, it appears roughly in equilibrium with a balance in pricing power between carriers and shippers. This rating is down 5 points from last week, when there was more seasonal tightness.
Three-month SONAR Pricing Power Index (PPI) Outlook: 60 – The freight market could be slightly in carriers’ favor in three months, primarily due to capacity exiting the industry and factors that temporarily boost demand, such as larger tax refunds. The potential for continued weakness in freight volume remains the biggest risk to that outlook. That rating is down 5 points
from last week to reflect that the market is typically weaker in early April (three months from now), as compared to late March.
Rejection rates begin to normalize
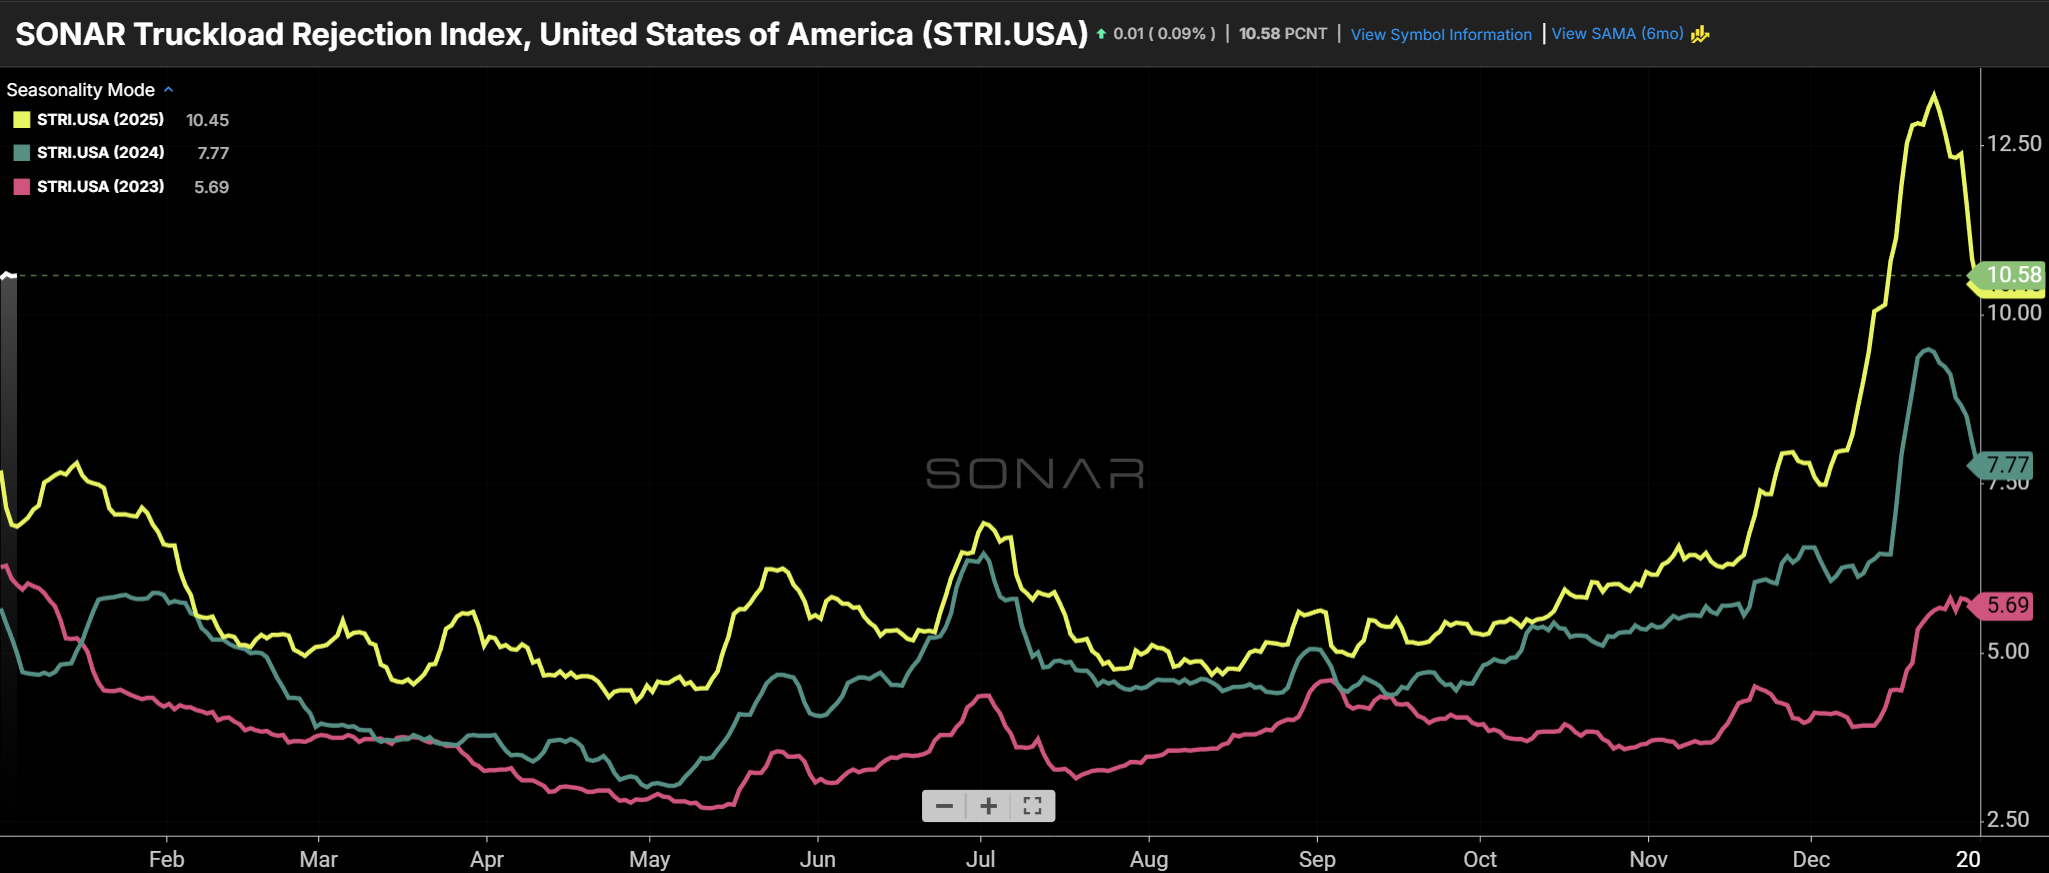
The SONAR Truckload Rejection Index (2026 – white line) shows that the freight market was tighter around the holidays in 2025 (yellow) than in the prior two years. (Chart: SONAR)
This trucking peak season, the national tender rejection rate hit a high of 13.2%, which was well above the past three years, including last year’s peak of 9.4%. The most recent reading returned the national tender rejection rate to 10.6%, an expected decline as capacity returned to the market. Capacity returned, and tender rejection rates declined most notably in the largest freight markets, including Ontario, California, and Atlanta, as expected. Ontario, California, the largest U.S. freight market, is showing a tender rejection rate of just 4.1%
The current national tender rejection rate of 10.6% suggests that the market is roughly in equilibrium between carriers and shippers, ahead of the 7%-8% threshold that is usually high enough to move spot rates higher. Presumably, the national tender rejection rate will decline further in the coming two weeks as more capacity returns to the market. History suggests that tender rejection rates will remain elevated through the end of January due to seasonal factors. However, so far, winter weather does not appear to be as bad (or as capacity-constricting) as it has been the past two years.
Segmenting tender rejection rates by equipment type shows that the reefer market is much tighter than the dry van market. The reefer market benefits from protect-from-freeze freight this time of year; that segment also did not have the massive capacity influx that dry van had following the COVID freight boom. Rejection rates are 11.5%, 18.5%, and 9.0% for the dry van, reefer, and flatbed, respectively.

Shippers are extending lead times, reflecting concern that capacity may not be available. See the recent FreightWaves article for additional details. (Chart: SONAR)
Demand picked up in December, but remains lackluster
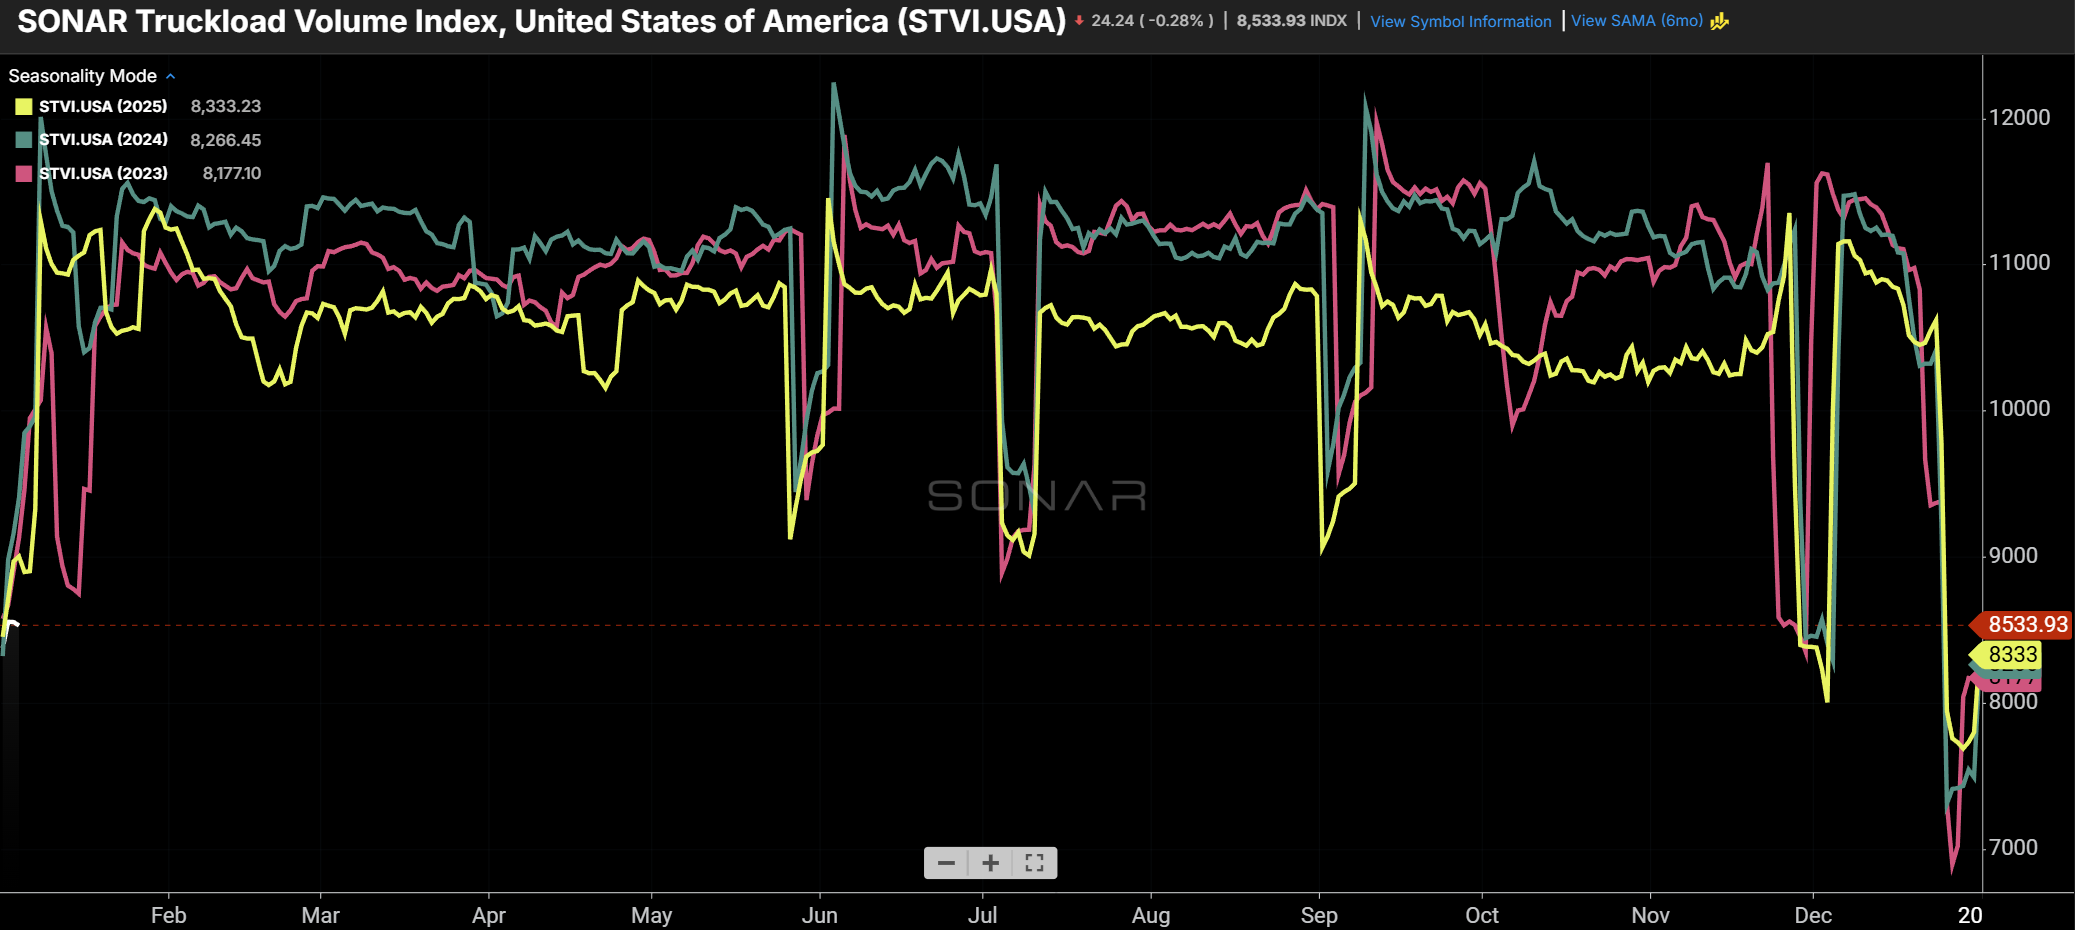
The SONAR Truckload Volume Index surged in December (2025 – yellow) from a depressed level. (Chart: SONAR)
The SONAR Truckload Volume Index showed that freight demand was weak throughout 2025, and it also shows that 2026 has gotten off to a slow start. Tender volume in the past week is down 4% year over year. But November and December freight volume showed considerable improvement starting about two weeks before Thanksgiving. It appears that trend was driven by consumer spending that held up better than forecasts and surveys suggested, which propped up the GDP growth rate. Looking ahead to the coming months, the outlook for higher average tax refunds (~$3,800 versus $1,000) and the potential for additional interest rate cuts, which could stimulate the housing market and the industrial economy, could serve as demand catalysts.
Spot rates start 2026 at an elevated level
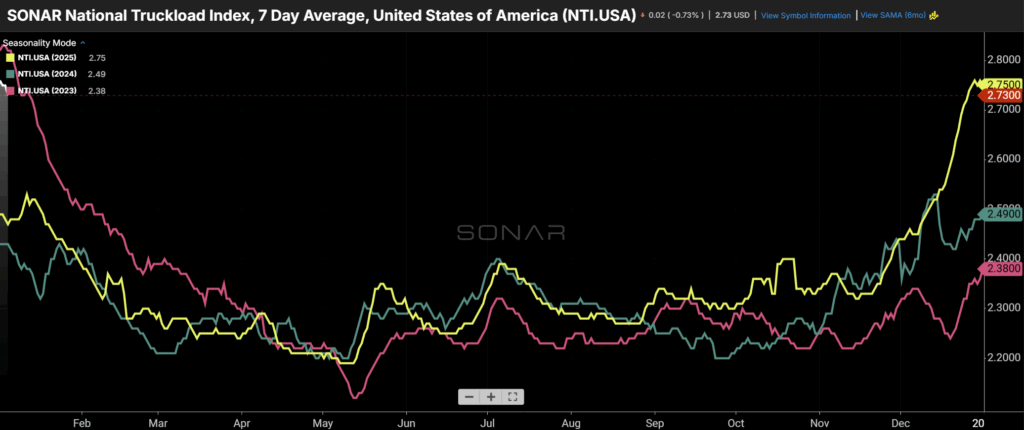
In a pattern similar to tender rejection rates, the average spot rate also surged in December. In fact, the spot rate surge was even more dramatic, hitting its highest levels since the 2022 holiday season. That suggests that a large portion of the tightening in the freight market came from smaller carriers, which disproportionately participate in the spot market, and also represent the segment of carriers least able to weather the prolonged freight recession.

The average spot rate, displayed in the SONAR National Truckload Index (NTI.USA), surged since mid-December and started 2026 at an elevated level. (Chart: SONAR)
About the SONAR PPI: The SONAR Pricing Power Index is a qualitative assessment of the balance of negotiating power between shippers and carriers on a scale of 0 to 100 using SONAR data and anecdotes from discussions with SONAR clients. The higher the number, the tighter the freight market and the more that pricing power favors carriers. A 50 represents a balanced market. While the SONAR PPI primarily pertains to the truckload sector, given its size, dynamics in other sectors, such as intermodal and ocean, are also considered.