Clearly a carriers’ market as the end of 1Q approaches
This week’s SONAR Pricing Power Index (PPI): 70 (up 5 points) – Both the national tender rejection rate and the national average spot rate continue to soar. The latest tender rejection rate is 14%, while the average spot rate is $2.98/mile, also a year-to-date high. Those metrics are easily beating seasonal norms, suggesting that the freight market has truly shifted to become a carriers’ market.
Three-month SONAR Pricing Power Index (PPI) Outlook: 75 (up 5 points) – The 3-month freight market outlook increases 5 points from last week’s report. Freight data that is better than seasonal norms through the end of March suggests that the second quarter is likely to be better than the first for carriers. The second quarter, which begins at the start of April, is normally a seasonally weak month for freight, but as the quarter progresses, there will likely be seasonal events that contribute to tightness, including International Roadcheck and Memorial Day. In addition, the freight market in the second quarter will also benefit from the seasonal shipments of summer merchandise, many of which are large and bulky.
Tender rejection rates hit fresh highs

The national tender rejection rate across all equipment types (2026 – white line) just hit its highest level of the past three years. (Chart: SONAR)
The national tender rejection rate increased 138 basis points to 14.73% in the past week to its highest level of the past three years. That provides further evidence to the view that the freight market has fundamentally shifted from the recent period of looseness that lasted almost four years. The latest tender rejection rate, which appears to be supported by an end-of-quarter surge in freight, is now above the 14.3% rate in the middle of Winter Storm Fern. Prior to the storm, carriers had been rejecting 9.8% of tenders.
Tender rejection rates have been particularly high in specialized sectors. The flatbed market appears especially tight with a 40.7% rejection rate. The improvement in the flatbed sector likely reflects a pickup in activity in the industrial economy, which has been cited by recent ISM indexes and Class I railroads.
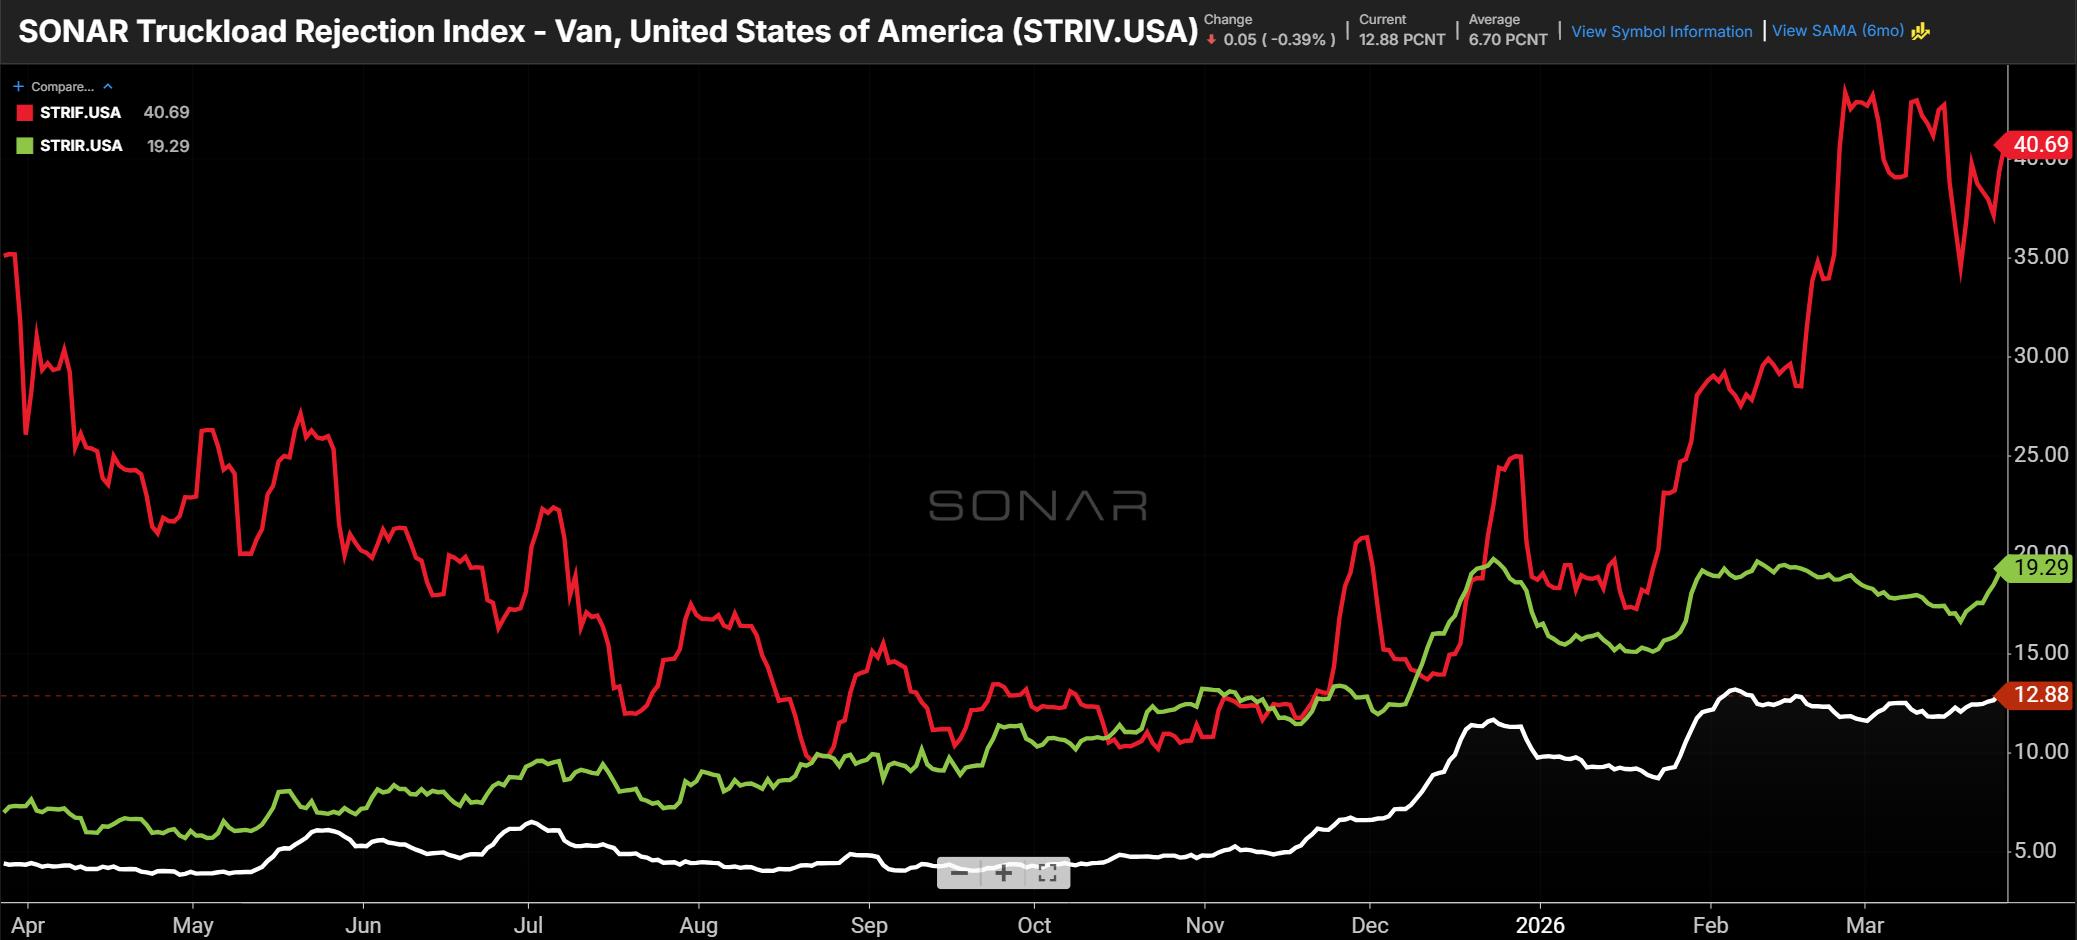
The SONAR Truckload Rejection Index is shown above for dry van (white), reefer (green), and flatbed (red) segments. (Chart: SONAR)
Spot rates surge to a new high
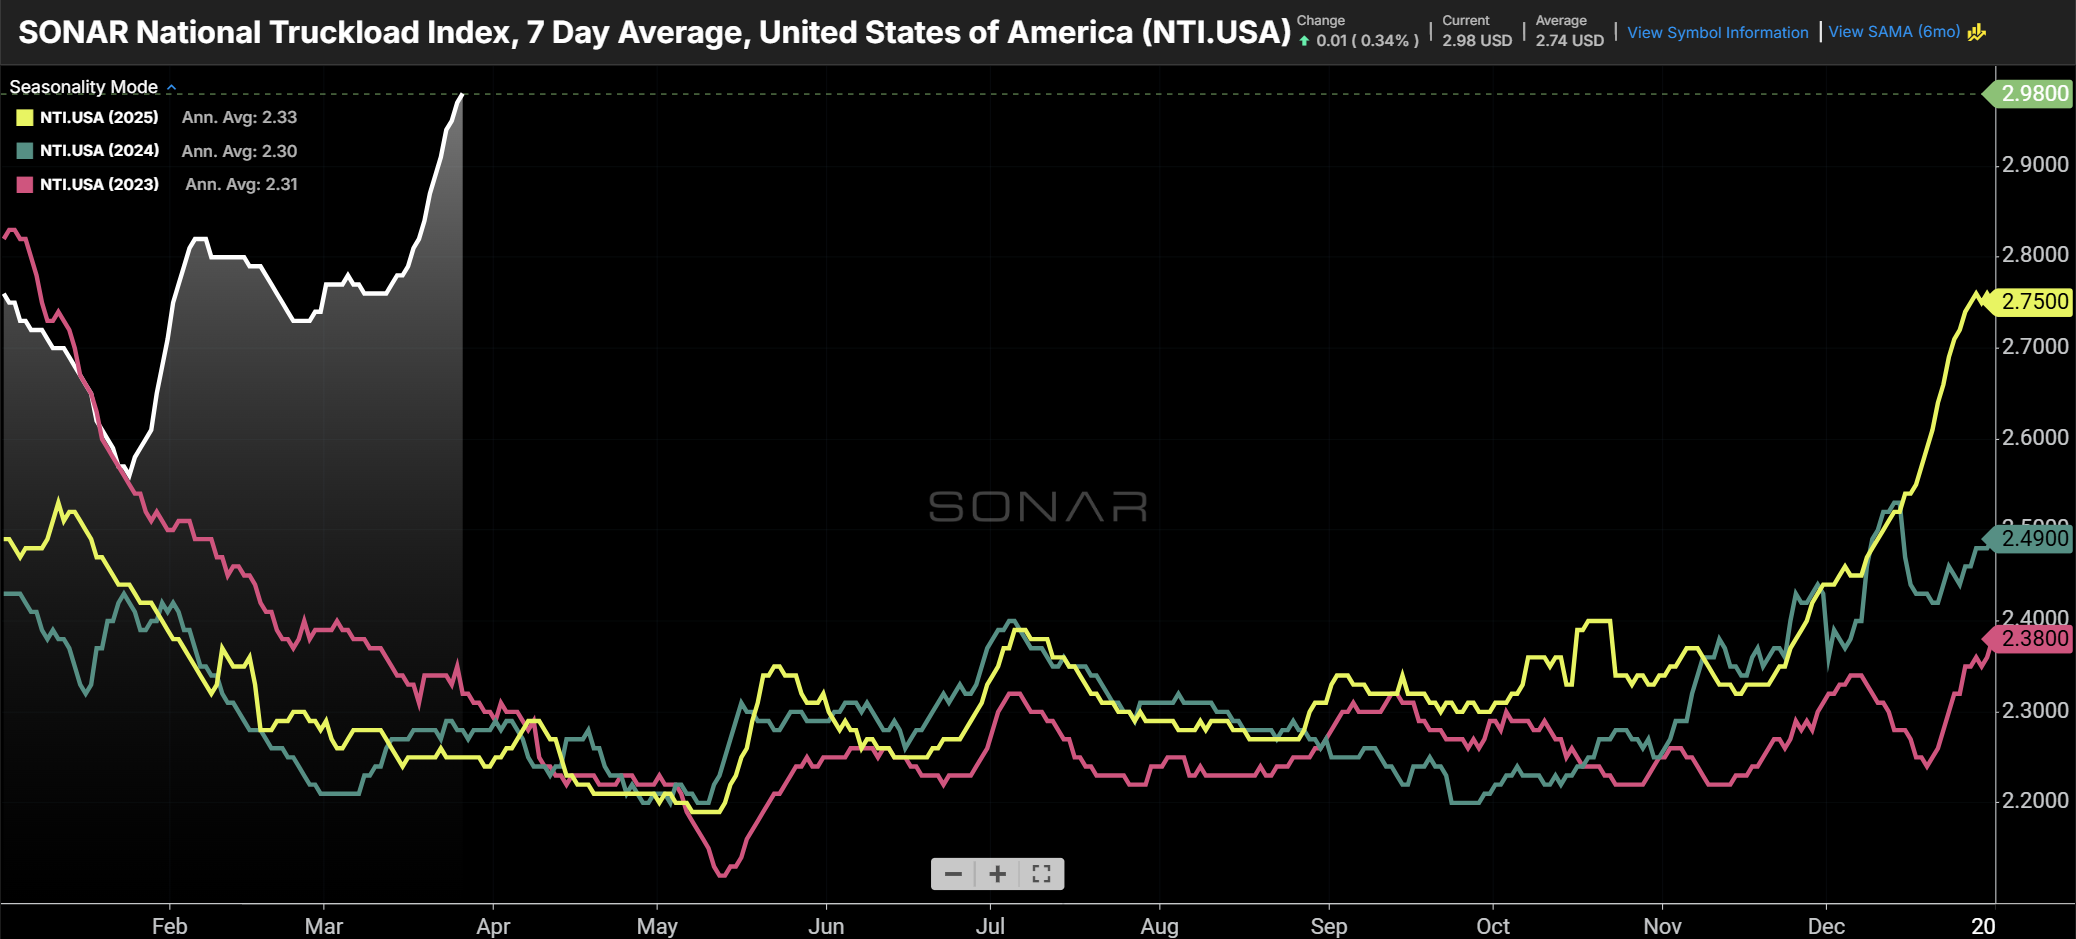
The average spot rate, displayed in the SONAR National Truckload Index (NTI.USA). (Chart: SONAR)
The national average spot rate in the past week increased by $2.82/mile to $2.98/mile. The week before last, it was $2.76/mile. Spot rates are inclusive of fuel surcharges, and some have suggested that the higher rates are simply a function of passing on surging fuel costs, which have risen ~40% since the start of the Iran conflict. Certainly, carriers are attempting to pass rising costs along, but history shows that carriers are only able to do that when the market is tight, as it is now.
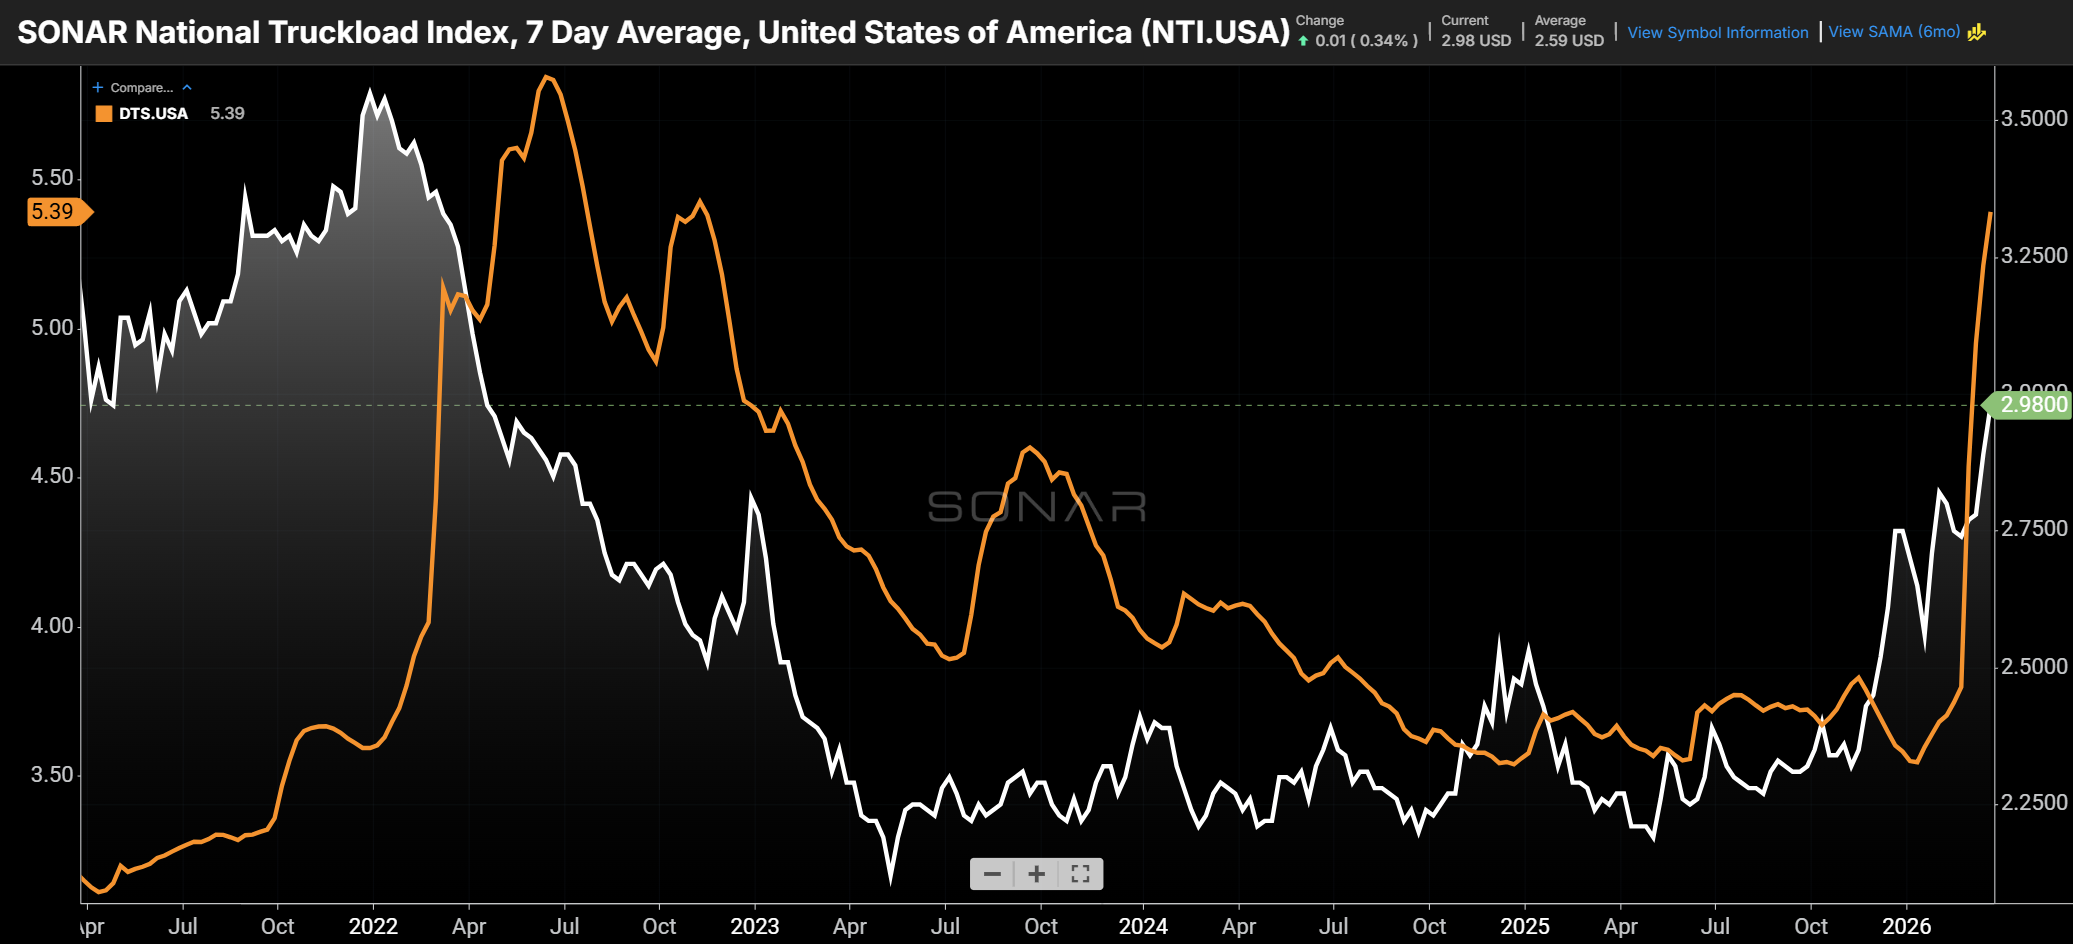
Comparing the average spot rate (white line) to Diesel prices (orange line) shows that when the freight market is loose, the spot rate does not rise commensurately with rising fuel prices. Examples of this include the third quarter of 2022 and the third quarter of 2023. (Chart: SONAR)
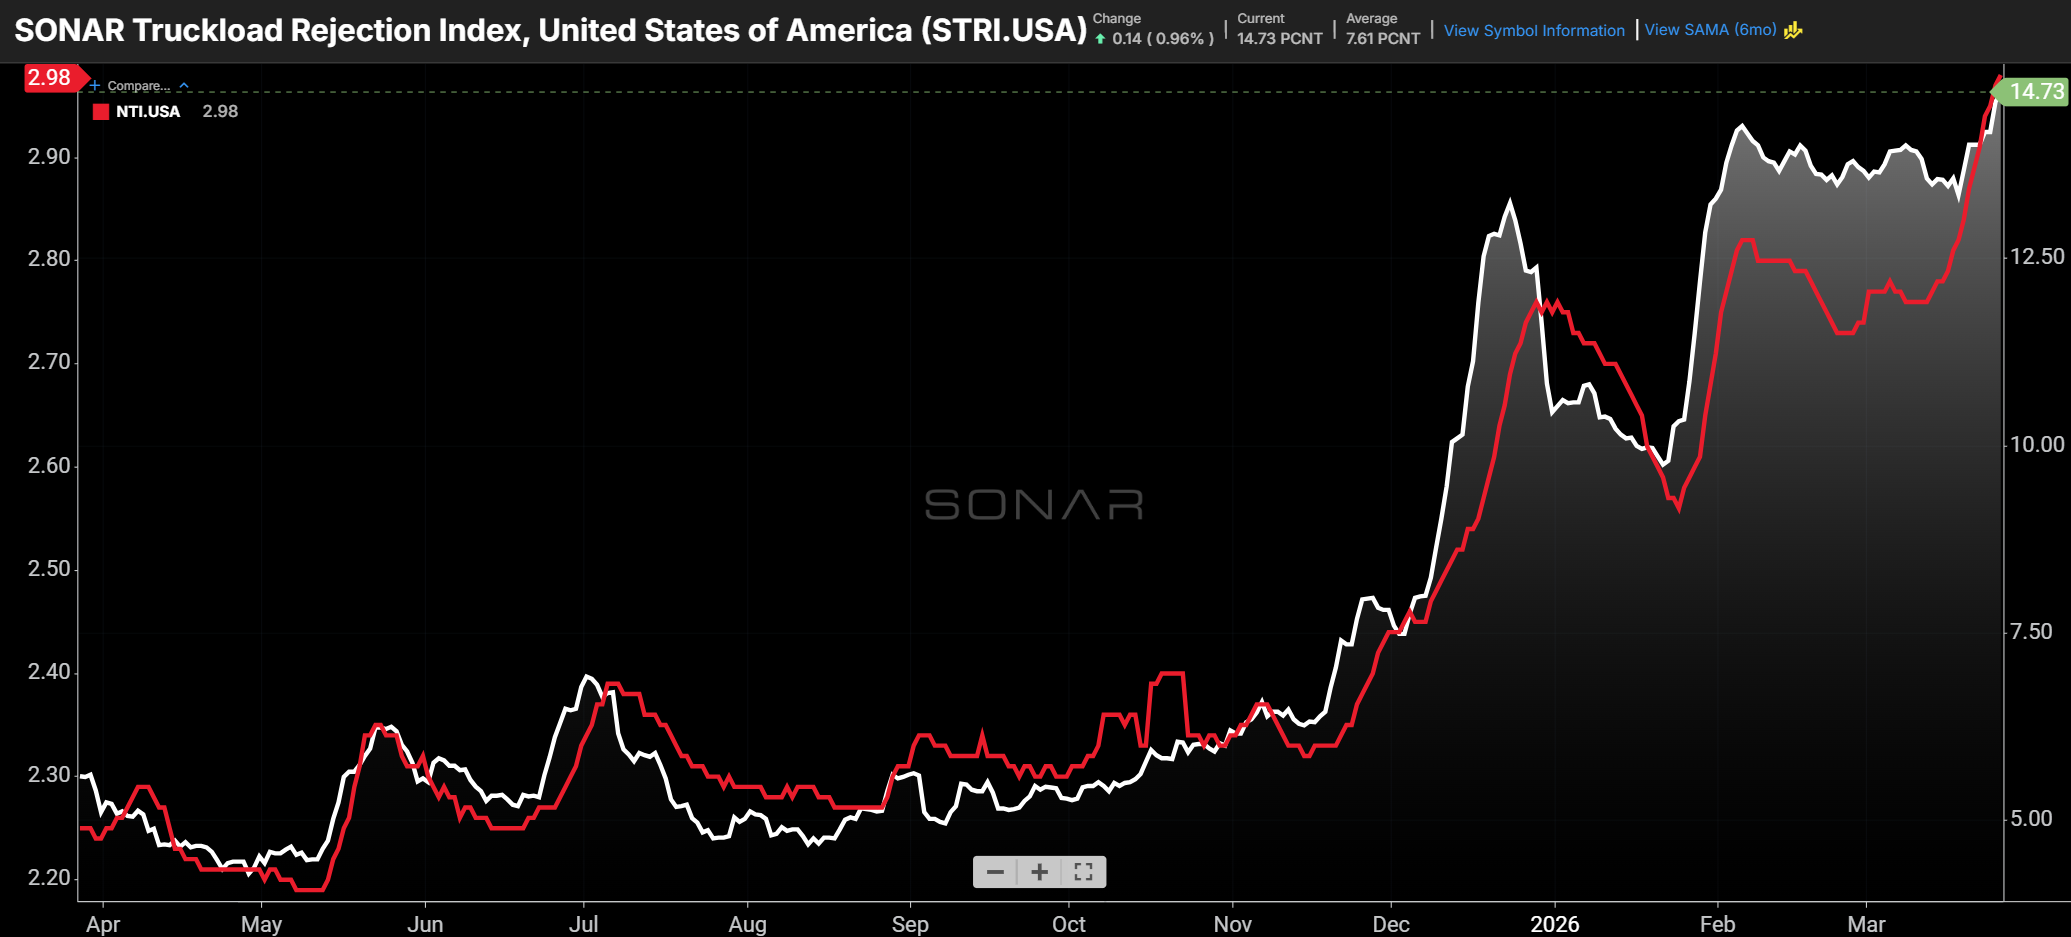
The national tender rejection rate (white) has shown to be a short-term leading indicator for the national spot rate (red). (Chart: SONAR)
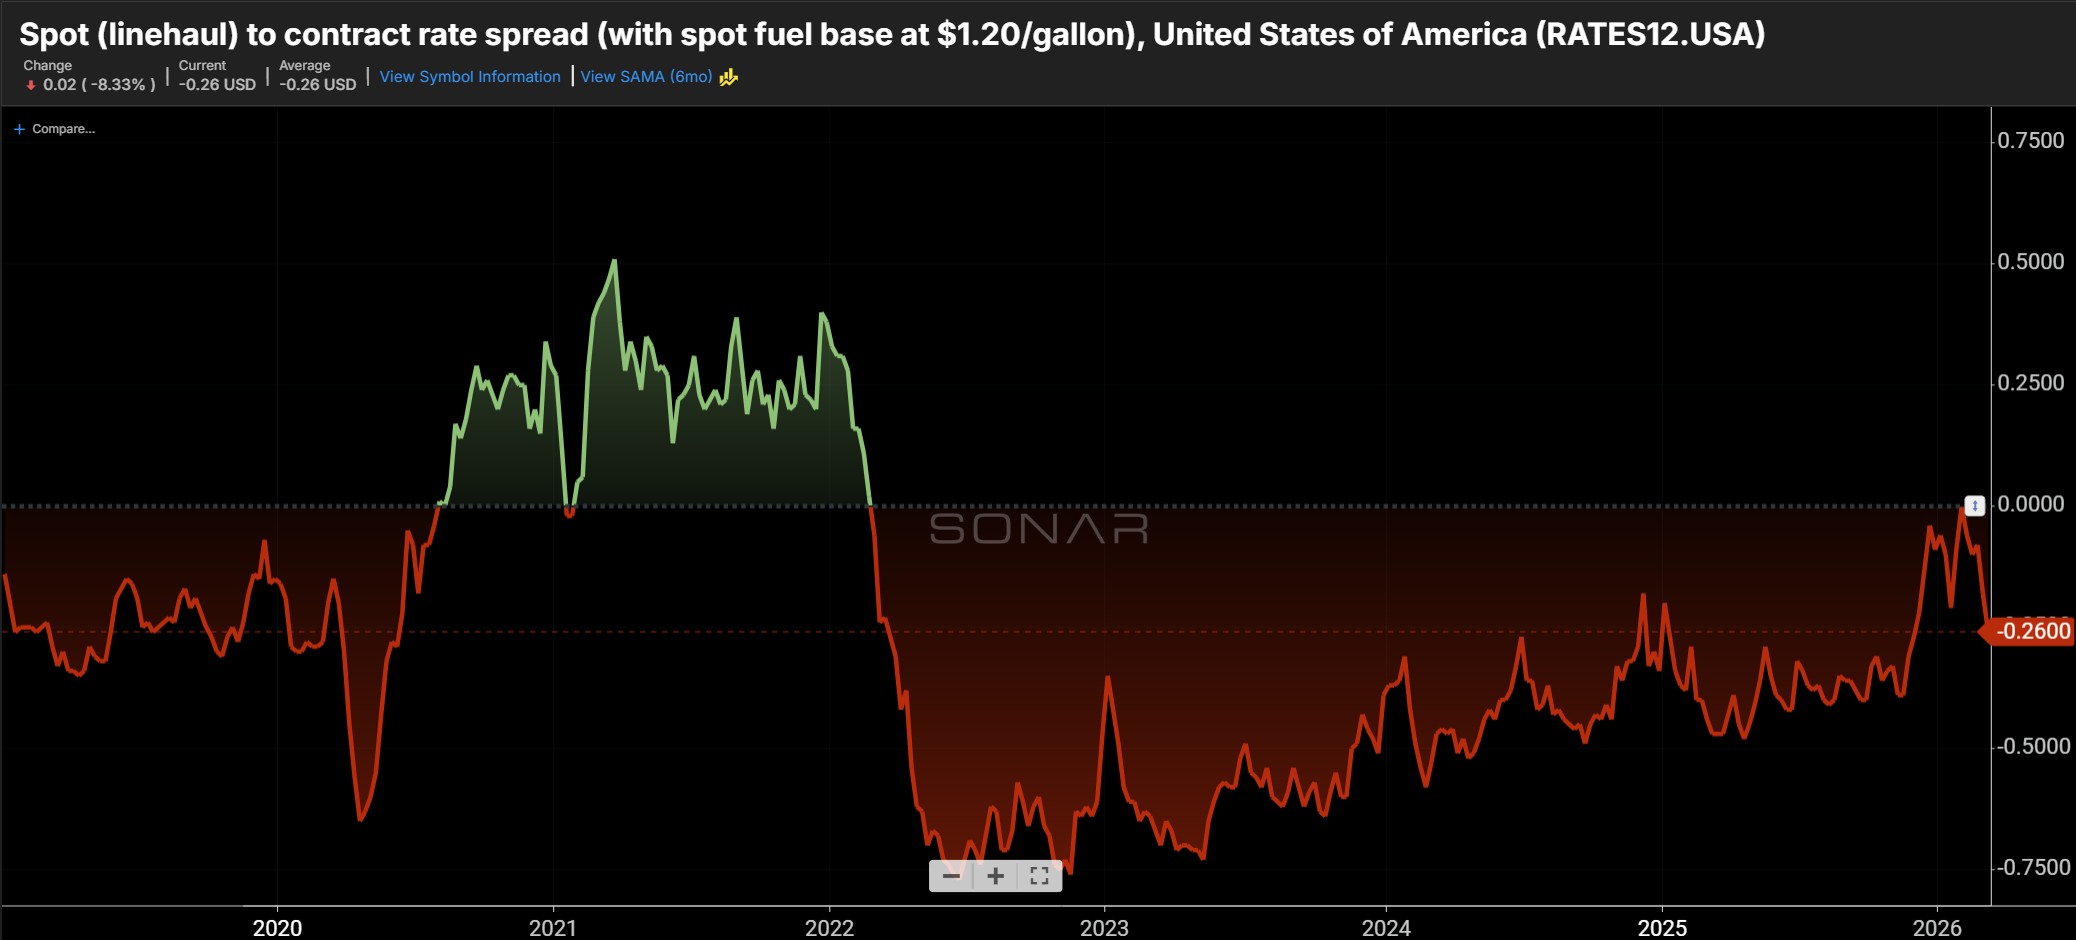
The average spread between spot rates and contract rates collapsed to start the year. However, the spread has widened somewhat in the past week with a rise in the average contract rate, reflecting routing guide deterioration. (Chart: SONAR)
Demand benefiting from industrial pickup and end-of-quarter shipments
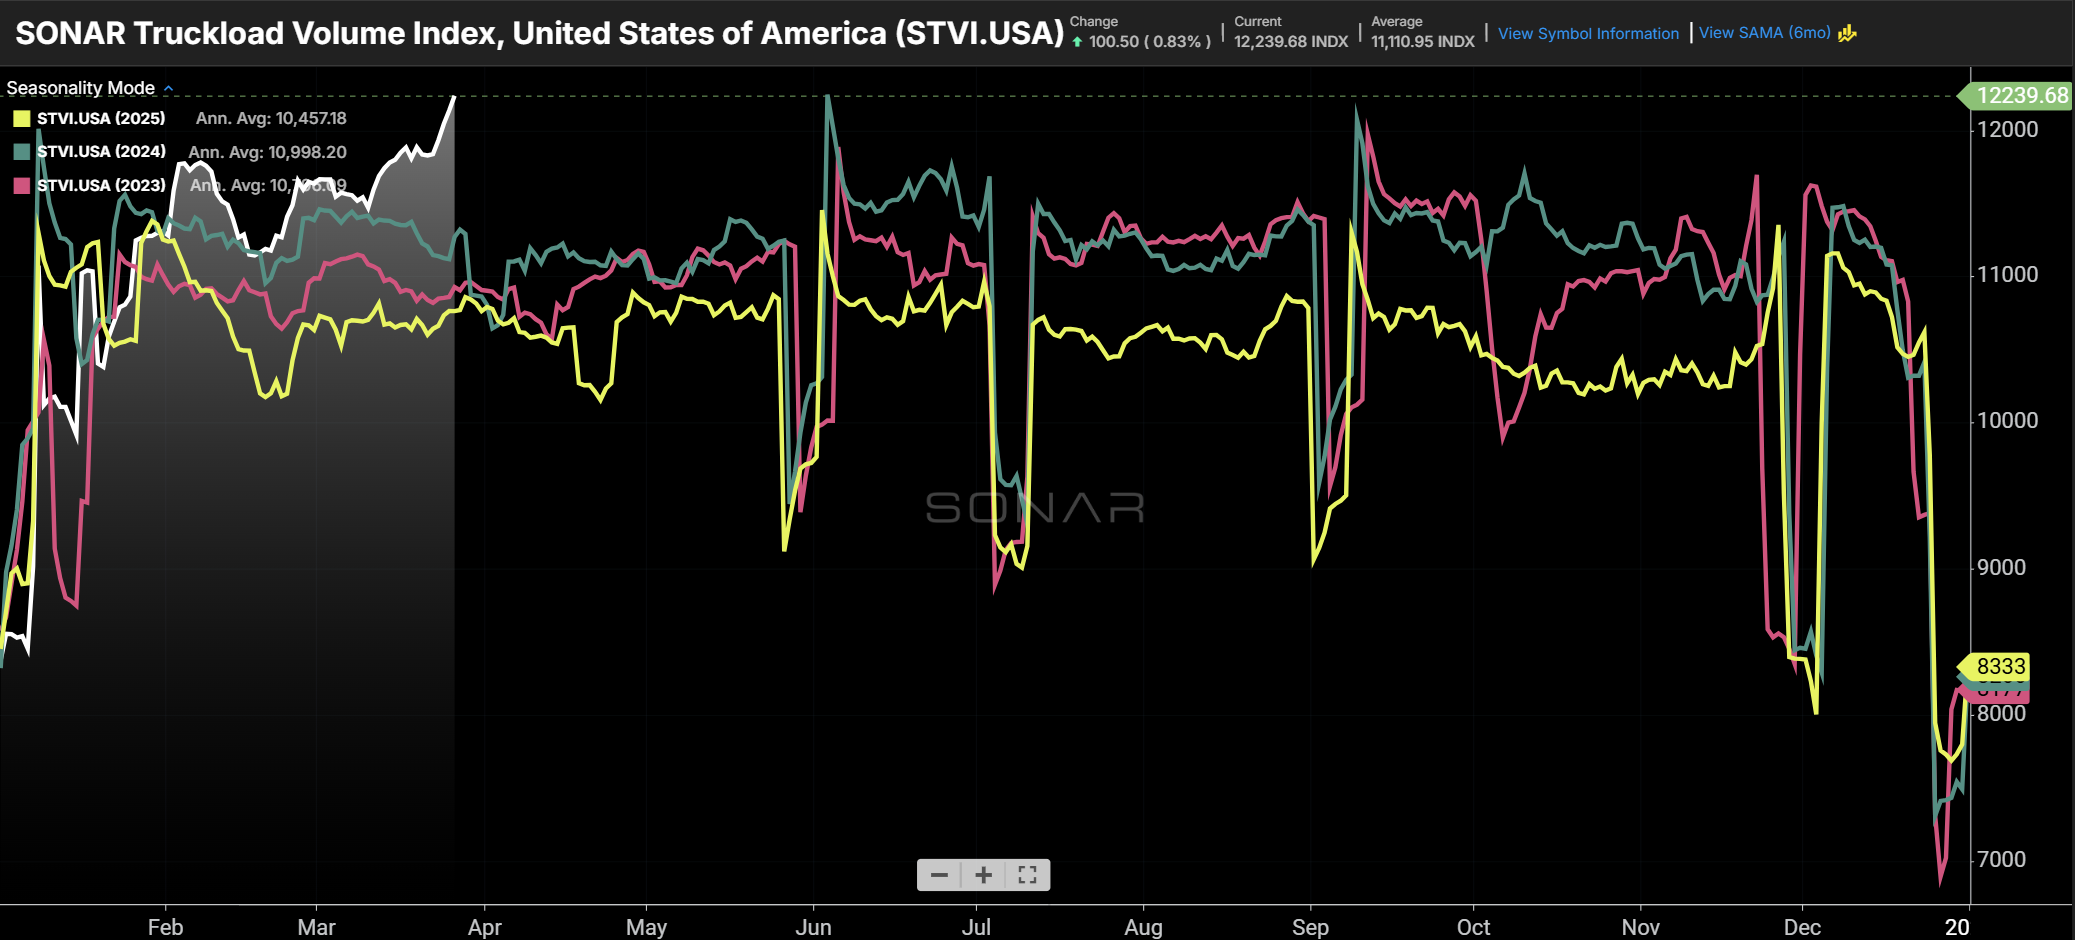
Total truckload tender volume, which includes freight that is tendered for the first time as well as freight that has been rejected and re-tendered, has surged to end the quarter. (Chart: SONAR)
The volume of accepted tenders has also picked up in the past two weeks. This chart understates the total freight volume movements when compared to 2025 and 2024, because it does not include freight that falls through the routing guide and ultimately moves on the spot market. (Chart: SONAR)
About the SONAR PPI: The SONAR Pricing Power Index is a qualitative assessment of the balance of negotiating power between shippers and carriers on a scale of 0 to 100 using SONAR data and anecdotes from discussions with SONAR clients. The higher the number, the tighter the freight market and the more that pricing power favors carriers. A 50 represents a balanced market. While the SONAR PPI primarily pertains to the truckload sector, given its size, dynamics in other sectors, such as intermodal and ocean, are also considered.