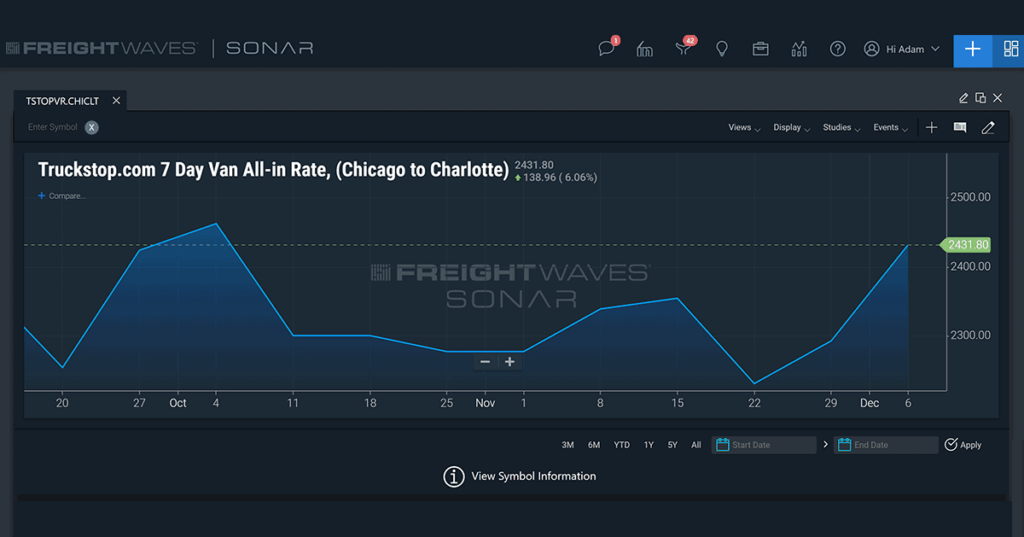
The freight market continues to swing upward. According to John Schulz of Logistics Management, “experts’ advice for shippers to try and mitigate those rates is to drive efficiency for carriers by reducing waiting times at terminals, offering ‘driver friendly’ freight and trying to save minutes off drivers’ ever-valuable on-duty time during their runs.” It would seem to come down to tracking these truckload freight rate index values.
Yes, industry experts have spoken about the value of supply chain metrics for years. And the ability to apply data for meaningful insights is essential. But that has created some problems. Chief among them is a simple misunderstanding of freight rate index value and what index will help improve operations.
Many enterprises have built unique real-time freight data indices. Sure, each adds value to the company. But they lack the external component. They lack the full scale and power of a real index. And it’s time to redefine the freight rate index with tendered, real-time FreightWaves SONAR data.
Defining the freight rate index
A freight index is a calculation based on industry freight data. Rate indices collect pricing data from all trading parties. That includes carriers, shippers, forwarders and brokers. Analysis of that data creates a benchmark rate. Transportation benchmarking simply means that the index reflects the pricing or demands for a given lane or aspect of the supply chain at any time. Its value lies in its consistency.
For instance, collecting data once per week (and some providers only collect twice per month) on Thursdays might work. But collecting data nightly would provide more value and more accurate forecasts.
In turn, that adds visibility into freight rates. And it improves supply chain relationships by informing conversations. Therefore, companies learn to trust in one another and collaborate for improvements across the full network.
Why in-house indices don’t work well
It’s time to face the simple fact. All companies operate some form of an in-house index. An in-house freight rate index rarely considers data beyond the four walls of the enterprise. While there are exceptions, it comes down to whether a transportation analytics add-on within an existing TMS shows true market conditions. The reality is that most add-on functions may not capture the real market-wide view. At the same time, in-house freight analytics insights are immensely expensive to build. And even once the analytics begin working correctly, recurring maintenance costs make in-house resources cost-prohibitive. Therefore, more companies turn to third-party data analytics platforms like SONAR.

Characteristics of a leading freight market rate index
The decision to leverage a freight rate index is obvious. But not all indices and freight resources are created equally. As a result, companies looking for a rate index platform or tool should look for one that has these features/advantages:
- Larger sample size. A larger data sample size amounts to more granular and marketwide views of potential trends.
- Consistent data collection. Consistency in data aggregation and analysis are key to maintaining index validity and accuracy.
- Near-real-time data. Gathering data after the fact is standard, but collecting data in near-real-time is even better.
- Instantaneous analysis. Using near-real-time data is also a critical step in applying and deriving fast, actionable analytics that offers all types of transportation analytics like descriptive and predictive analytics.
- Creation of meaningful insights. Creating a singular freight rate index is not the end of the equation, and using indices, freight management parties can create additional meaningful insights and supply chain KPIs.
- Drill down functions. Seeing a market-wide logistics business index can help, but it should also give a user the ability to drill down into the data and understand its contributing factors.
- Dynamic development. Ongoing development of a rate index engine means continuously revising algorithms and developing new indices that will add value.
See the varied freight rate indices with SONAR
The shipping world can be your oyster with a lineup of detailed freight rate index insights. And SONAR makes that possible with easy-to-use interfaces, pre-built dashboards in the knowledge center and APIs for advanced users. It’s time to stop throwing money at in-house freight rate index problems; get on the right track with SONAR-driven freight market analysis. To request a SONAR demo, and check it out in action today.


