A spot rate benchmarking tool has become an essential application for brokers, carriers and shippers to have at their fingertips. While being able to return a spot rate per mile on a lane is a valuable data point, the rate alone cannot paint a full picture of the market conditions that are influencing that rate up or down.
By being able to understand markets that are experiencing volatility in pricing and capacity along with the rate per mile, SONAR customers are using the newly released Market Conditions map to strategically determine their buy and sell rates to provide the best return based on their goals.
Rates Combined With Market Conditions: Your Competitive Advantage
Imagine you are a broker or shipper who is working on coverage for a spot load that just came across your desk. Negotiating the rate based on the market rate may only get you so far when every dollar counts toward your margin or budget goals. If you were able to see current capacity trends, it would be much easier to understand if you were able to push the rate down or move on to another interested carrier to secure the best rate. Conversely, if capacity is tight in that particular market, knowing that information would be crucial to ensure you accept the most market relevant rate as early as possible in the process to ensure you are not losing margin or budget dollars as the day progresses and capacity tightens.
Market Conditions in Market Dashboard
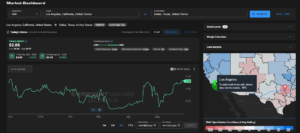
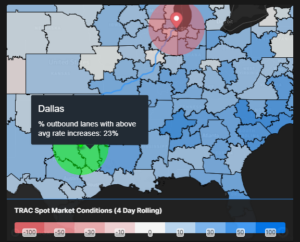
Market Conditions within the Market Dashboard tool provides a heat map of markets where rates are either increasing or decreasing more often so that pricing or budget can be adjusted accordingly. Markets in red have lowering rates (and generally looser capacity) while markets in blue have the majority of the lanes with increasing spot rates, allowing users to get a sense of current market conditions and rate trends at a quick glance.
Put simply, the Market Conditions tool is a map that gives SONAR users an indication of a market that has a higher amount of increasing or decreasing outbound lanes based on rates in the spot market over the previous four days. Market Conditions is available for van, reefer and flatbed equipment types. The legend of the map ranges from red markets (negative) to white (stable) and blue (positive). Details are available by hovering over the market area, and when reading the colors for each, it is important to note what each color indicates:
- Red = More rates for lanes outbound from that market have decreased than increased
- Blue = More rates for lanes outbound from that market have increased than decreased
- White = Rates for lanes outbound from that market have the same amount that increased and decreased, or there was no overall movement in rates
All Players in the Industry Can Benefit From Understanding Market Conditions
Regardless of your place in the trucking industry, understanding the conditions around your spot load pricing is crucial.
For brokers, the Market Conditions map helps identify which outbound markets are showing overall increases in rates. Customer sales reps can then target markets where capacity is tightening to increase their win rates when calling on customers. Capacity procurement reps can determine when to cover their loads and have more tools in negotiation to ensure they are hitting their margin targets.
For asset-based carriers, the Market Conditions tool helps identify markets that have opportunity and markets that are at risk for low rates or harder to move capacity out. By determining which markets to target or avoid based on spot opportunities, carriers can increase their negotiating leverage to ensure a good balance between utilization and compensation.
For shippers, Market Conditions can help determine which markets are experiencing volatility, which can lead to service disruptions. In the current environment, rates on both contract and spot loads have been low, which can lead to service disruption if the spot rates increase, as carriers will move assets where they identify the best opportunities.
Submit a demo request to learn more about how you can utilize SONAR data at your organization or follow us on social media for your daily dose of freight!


