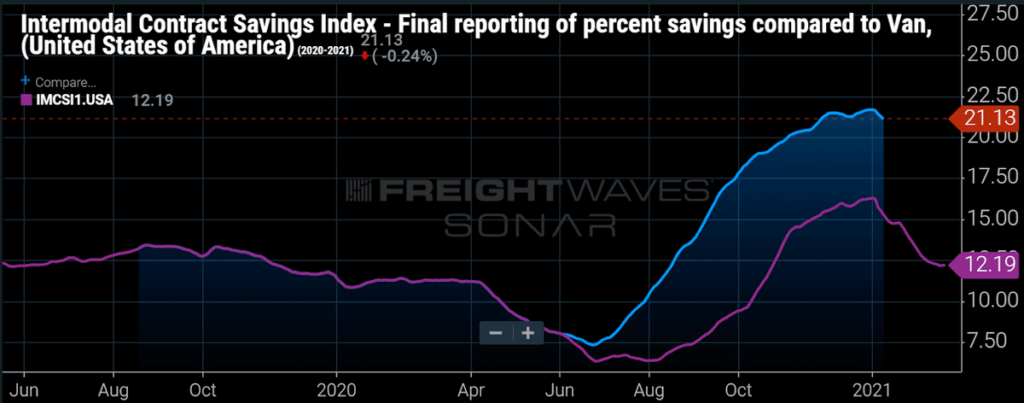
In this edition of “SONAR Indices & Insights,” readers will learn about the FreightWaves SONAR intermodal contract savings versus truckload tickers, added to SONAR so shippers, carriers, intermodal marketing companies and analysts can see the average percent difference between intermodal transportation contract rates and truckload contract rates on the same lane.
These latest tickers again reflect FreightWaves’ commitment to provide the latest data insights in SONAR – across all logistics concerns relating to OTR transport and other modes of transportation.
This week, learn how SONAR subscribers are using these intermodal transportation rates versus truckload tickers and what they tell freight market participants.
SONAR’s intermodal contract savings versus truckload (IMCSI) ticker shows the percent difference between the domestic intermodal transportation contract rate per mile (all-inclusive) and the truckload contract rate per mile (all-inclusive) on the same lane (i.e., same origin-destination pair). The Intermodal Savings Index tickers are derived from the SONAR contract rate data described here but with a key difference – these are calculated as all-in freight rates versus transportation only.
The intermodal contract saving indices (IMCSI) show the percent savings on the rates shipping via intermodal rather than via dry van truckload. To ensure comparability across modes, the calculation only compares truckload and intermodal rates in identical origin-destination pairs. The IMCSI tickers are an aggregation of individual lanes.

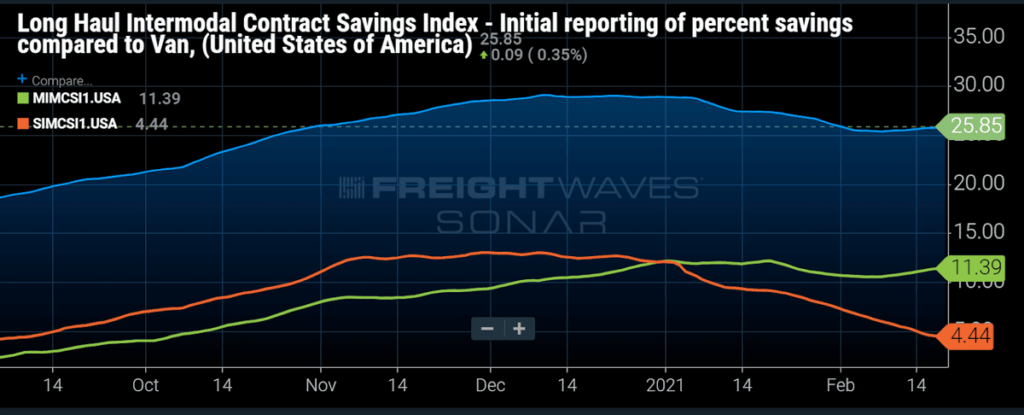
The SONAR chart above shows the initial and final reported intermodal transportation savings versus truckload transportation values. The intermodal savings indices and their subsequent length of haul tickers are divided into initial and final values. The initial reports provide values after 14 days, while the final value is reported after 56 days.
The Intermodal Savings Index is reported in SONAR on a national level and is broken down in two ways:
The tickers are as follows:
The intermodal contract savings indices are also offered in various lengths of haul in order to isolate the various differences between shorter and longer haul lanes at a more granular level. Price differences between longer mileage moves tend to be greater than shorter mileage moves with large differences between each mileage band. Greater variety affects pricing. At this time, these indices are only available at the national level.

The intermodal transportation contract indices show the average percent difference between intermodal contract rates and truckload rates on the same lane. The indices, therefore, show the percent savings that shippers might expect to receive on a freight contract using domestic intermodal rather than truckload. The savings associated with intermodal relative to truckload, which is typically around 10%-15%, is intended to compensate shippers for the typically lower service level associated with intermodal.
The initial reports give the quickest view of the direction of the potential savings while sacrificing a level of accuracy for quicker decision-making. The final reports offer a much clearer view, having the majority of the reports for that time period for validation and historical reporting.
The length of haul variations can be viewed within LIMCSIF.USA, MIMCSIF.USA and SIMCSIF.USA respectively.
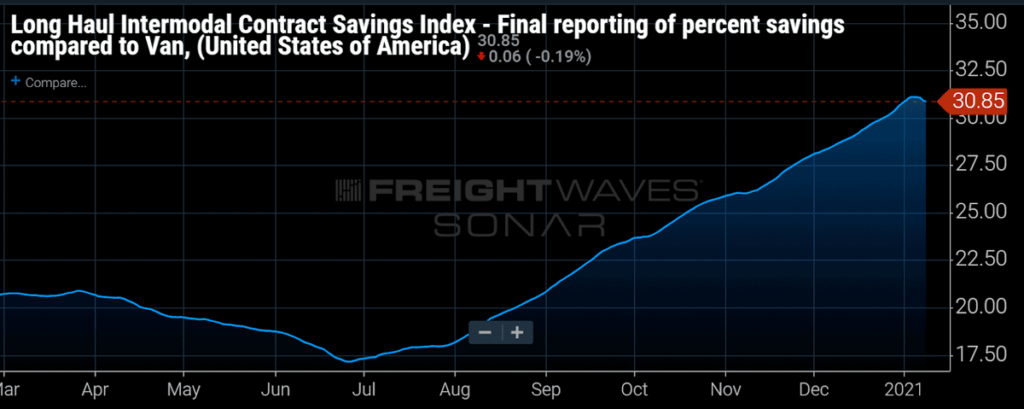
For example, the graphic below further demonstrates the savings relationship at 56 days within the time of the movement down to 30.85% in long intermodal hauls of 1,200 or more miles.

The intermodal contract saving indices (IMCSI) show the percent savings of shipping via intermodal rather than dry van truckload contract rates. FreightWaves SONAR is the only freight analytics platform that has contract rates per mile, by multiple modes, so freight market participants can utilize the various tickers in SONAR to make real-time decisions related to pricing, freight costs, mode optimization, and proactive capacity planning. When one knows the cost variances of different modes, such as intermodal transportation versus truckload transportation, they are able to work towards optimizing their transportation spend.
FreightWaves SONAR is the fastest and most comprehensive freight market data and analytics platform in the world. These are just a few of the 150,000+ unique indices available to SONAR subscribers. Not a FreightWaves SONAR user yet? Sign up for a demo here or by clicking the button below.
