Tariffs continue to shape global trade and logistics, with effects rippling through supply chains, transportation, and warehousing. Using SONAR data, we examine how recent tariff changes are influencing the freight market across different sectors.
Canadian Trucking Capacity Tightens

With North American tariffs officially in place, shippers rushed to move freight from Canada to the U.S. ahead of the implementation. This led to a surge in outbound Canadian freight volume, with a notable increase in tender rejections by carriers. In January, only 4.8% of outbound Canadian tenders were rejected, rising to 6.6% in February. However, in the past week, that rejection rate has skyrocketed to 10.1%, reflecting tightening capacity and competition for lucrative spot loads.
US Flatbed Rejection Rate Spikes
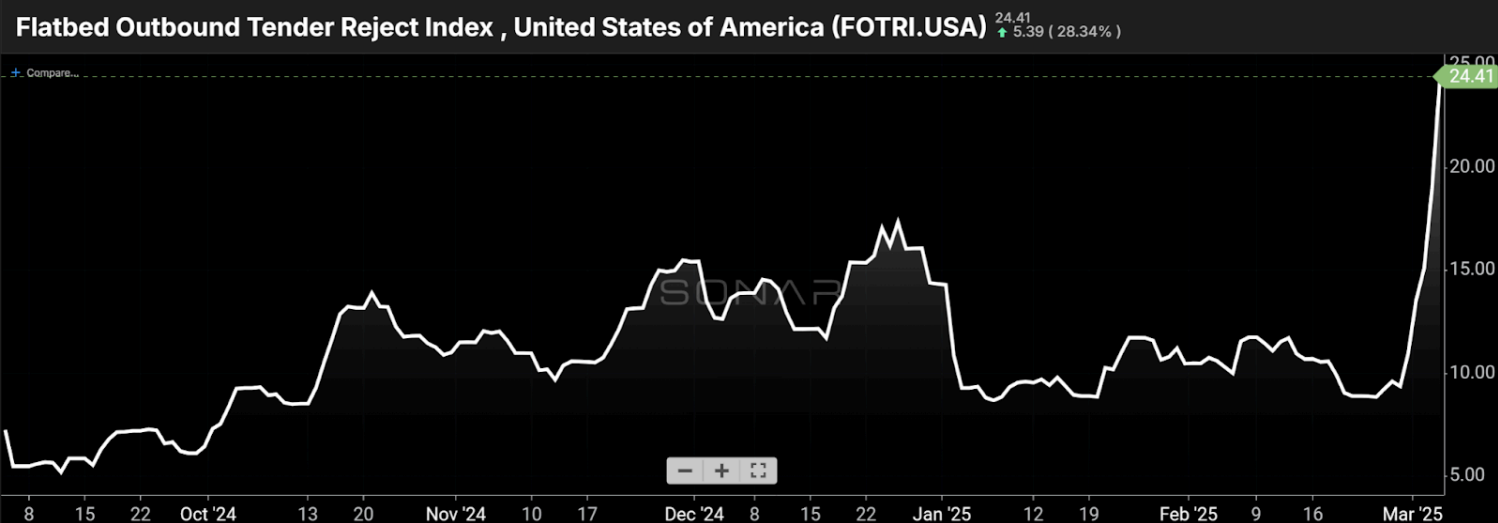
Flatbed carriers are rejecting 24% of tenders, up from 10% just a few weeks ago. This is largely attributed to last-minute efforts to move Canadian lumber before tariffs take full effect, further straining capacity.
China-to-US Ocean Spot Rates Plunge

Ocean freight rates from China to the U.S. have hit a 52-week low, down 59% to the West Coast and 45% to the East Coast since the start of the year. This decline reflects multiple factors beyond tariffs, including increased shipping capacity and seasonal trends. Additionally, a slowdown in post-Chinese New Year demand and a pull-forward of imports have contributed to the rate drop.
Air Cargo Rates at Pre-Pandemic Lows

Air cargo rates are nearing early 2020 levels, signaling a potential return to pre-pandemic pricing structures. A decline in business travel has reduced belly capacity on passenger flights, while booming e-commerce demand had previously propped up air freight rates. However, U.S. policy changes, including the potential removal of the de minimis exemption, could significantly impact low-value shipments and reshape air cargo dynamics.
US Import Bookings Hold Steady – For Now
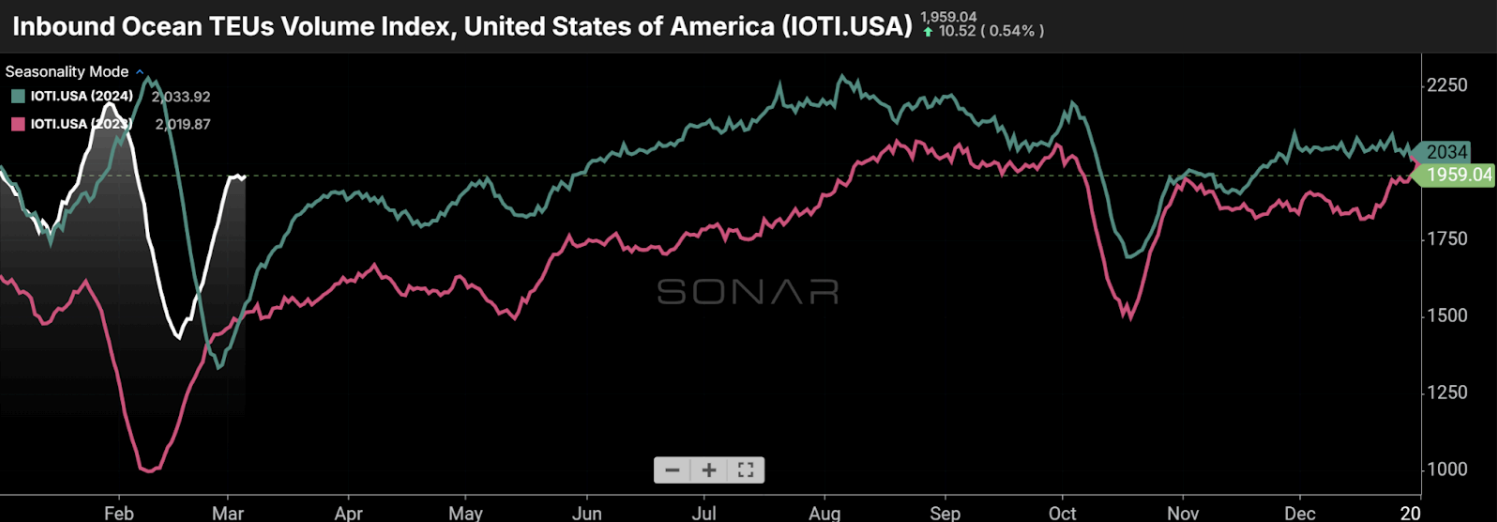
Despite fears of a slowdown, U.S. import bookings remain above last year’s levels. However, industry experts, including the National Retail Federation and Union Pacific Railroad, caution that much of this strength could be due to an import pull-forward ahead of tariff increases. If so, a sharp decline in demand may follow in the coming months.
Warehousing Costs on the Rise

Inventory levels have spiked as businesses stockpile goods to mitigate tariff-related disruptions. The Logistics Managers’ Index shows inventory levels and warehousing prices well above the expansion threshold, with warehousing costs climbing due to high demand and limited space.
Intermodal Volume Outperforms Truckload

Intermodal freight, particularly international and domestic rail shipments, is seeing stronger volume growth compared to truckload freight. With imports pulled forward, freight has become less time-sensitive, making intermodal a cost-effective alternative to traditional trucking.
Conclusion
Tariffs are having wide-ranging effects across transportation and supply chain sectors. From trucking to ocean freight, air cargo, and warehousing, SONAR data highlights how market conditions are shifting in response to trade policies. As businesses adapt, staying informed with real-time analytics will be crucial for navigating these evolving challenges.
For more insights and data-driven analysis, visit SONAR or request a demo today.