Tender volumes tell you what shippers want to move. Accepted volumes tell you what’s actually happening.
That distinction matters — and until now, SONAR users had to do the math themselves.
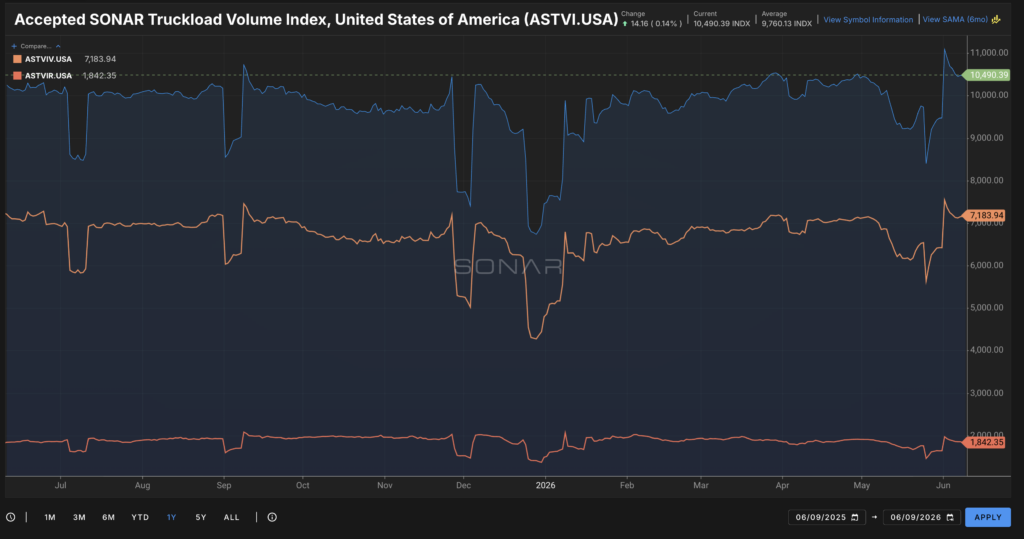
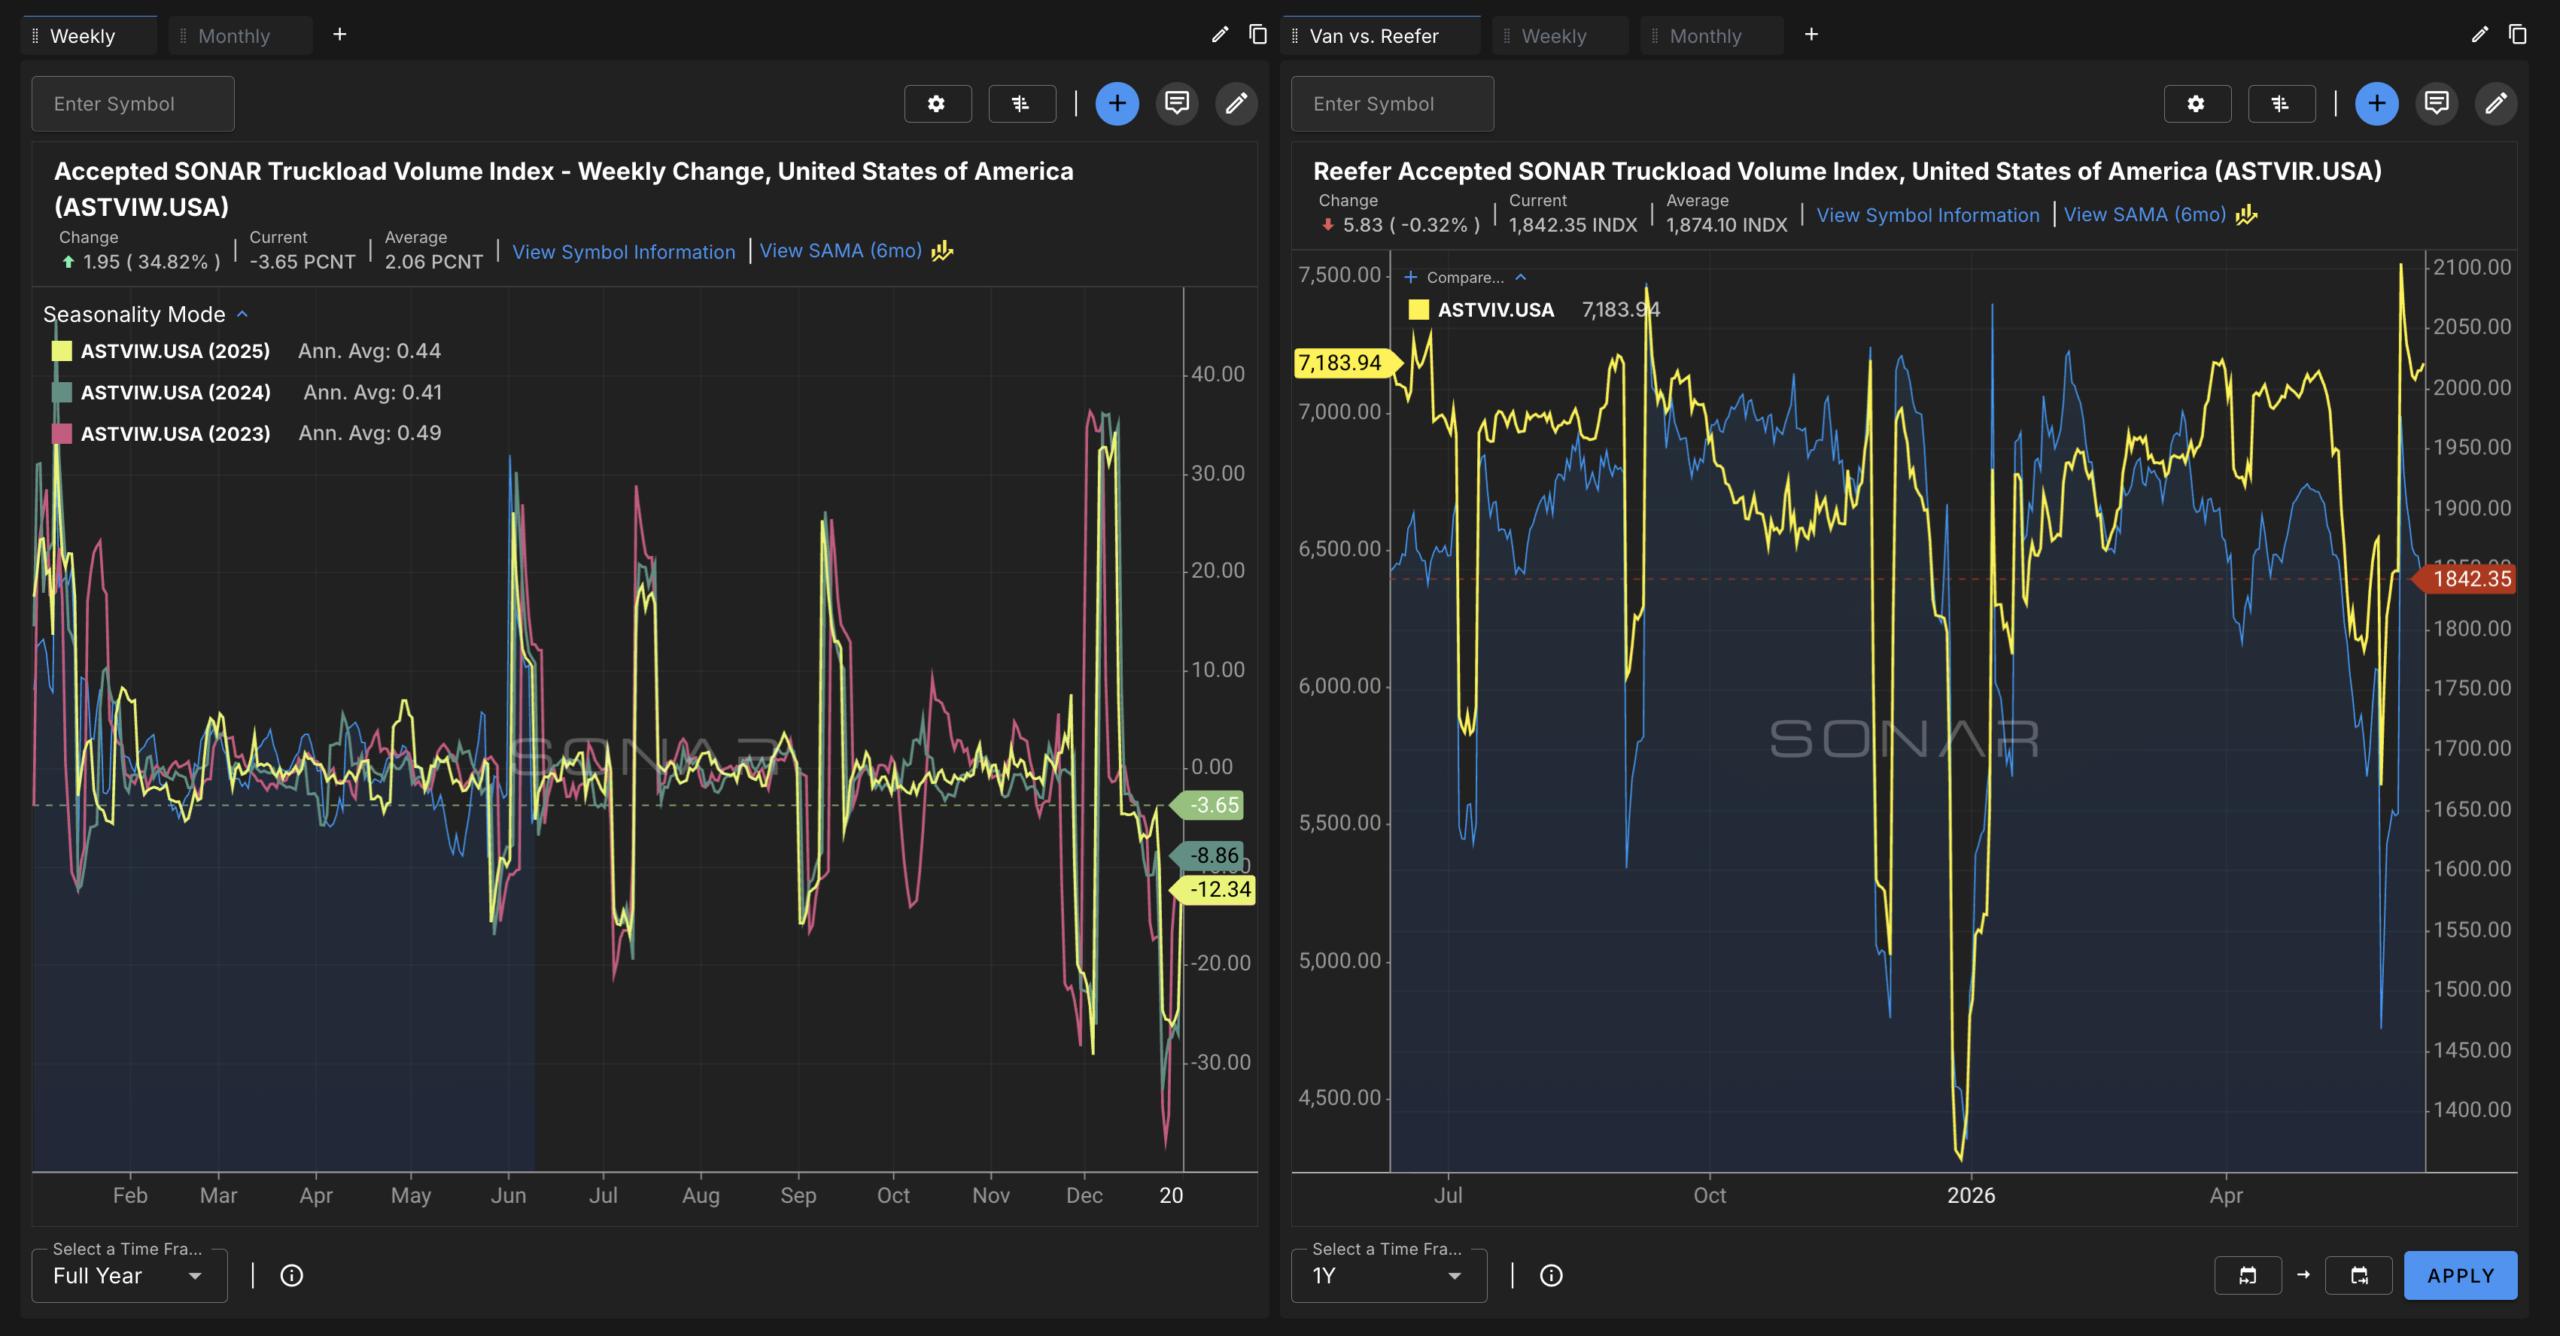
Today, SONAR launches the Accepted SONAR Truckload Volume Index (ASTVI): a new family of datasets that strips out rejection activity and surfaces only the freight that cleared the routing guide and moved. For anyone making decisions based on truckload demand — brokers, carriers, shippers, analysts, transportation leaders — this is the signal you’ve been working around.
Why Accepted Volume Is the Right Denominator
Tender data is powerful. But tendered freight and accepted freight are two different things, and in a soft market, the gap between them can be wide. Routing guides erode. Primary carriers reject. Spot exposure quietly grows.
When you’re tracking demand trends, modeling capacity pressure, or evaluating whether your routing guide is actually performing, you need to see the denominator: the volume that cleared. ASTVI is built for exactly that.
What’s in the Index
ASTVI is available at the national, regional, and market levels, updated daily. The full dataset suite covers:
Accepted Volume
ASTVI— Accepted SONAR Truckload Volume Index (total)ASTVIV— Van accepted volumeASTVIR— Reefer accepted volume
Weekly Change
ASTVIW— Total accepted volume, week-over-weekASTVIWV— Van, week-over-weekASTVIWR— Reefer, week-over-week
Monthly Change
ASTVIM— Total accepted volume, month-over-monthASTVIMV— Van, month-over-monthASTVIMR— Reefer, month-over-month
Yearly Change
ASTVIY— Total accepted volume, year-over-yearASTVIYV— Van, year-over-yearASTVIYR— Reefer, year-over-year
What You Can Do With It
Brokers can identify markets where accepted volume is climbing ahead of capacity — before rates move.
Carriers can track equipment-specific demand trends by mode (van vs. reefer) across the lanes that matter most to their network.
Shippers can use routing guide performance data more precisely, correlating acceptance rates with actual volume movement to understand where guide compliance is breaking down.
Analysts and transportation leaders gain a cleaner picture of seasonal demand patterns and truckload market cycles, unobscured by rejection noise.
Available Now in SONAR
ASTVI datasets are live today. Pull them at any geographic level — national for macro trend-watching, regional and market-level for the granularity that drives real operational decisions.
If you’re already using SONAR’s tender data, layer ASTVI alongside it. The comparison between what was offered and what was accepted is one of the most telling stories in freight.