Freight Capacity Is Tightening Before Demand Recovers — Here’s What Q2 2026 Earnings Actually Show
Q2 2026 earnings from 66 public freight companies confirm the freight cycle is turning — but it’s still early, and it’s a supply story, not a demand story. Regulatory enforcement (non-domiciled CDL rules, English-proficiency requirements, the Montgomery v. Caribe Transport II broker-liability ruling) is pushing marginal capacity out of the market faster than volume is recovering. Large carriers are responding by protecting margin and utilization — not by adding trucks.
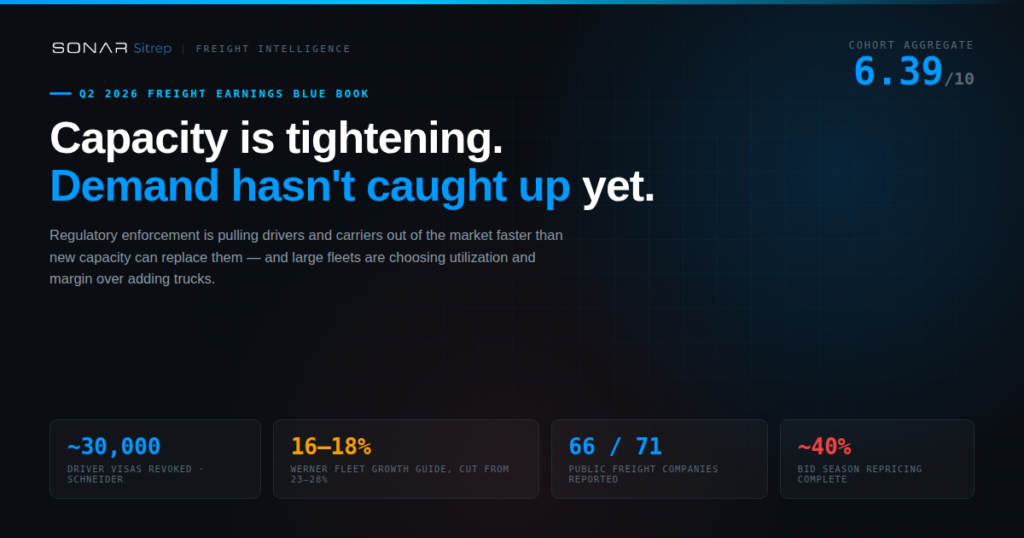
- Schneider: ~30,000 driver visas revoked this quarter, tightening cabotage capacity directly
- Werner cut its fleet-growth guidance to 16-18%, down from 23-28%
- Cohort aggregate bullishness: 6.39/10, with capacity firmer than demand
- Key cycle stages — bid season repricing, EPA 2027 pre-buy — still only 40-55% complete
The cycle is turning, but it’s a supply story
Every Class I railroad, most truckload carriers, and every public LTL carrier posted meaningful revenue growth in Q2 2026. Tender rejections and spot rates are both climbing. But look at where the pressure is actually coming from: it’s capacity leaving the market under regulatory enforcement, not a wave of new freight demand pulling the market tight. That distinction matters for anyone trying to time contracts, capex, or hiring against this cycle.


The more telling comparison is what volume was doing at the same time. SONAR’s STVI (national tender volume index) moved sideways through Q2 2026 even as rejections climbed sharply — direct evidence that this is capacity leaving the market, not demand surging into it.

Why is capacity tightening? Regulatory enforcement, not a driver shortage
The clearest, most quantified data point of the quarter came from Schneider National, which disclosed that approximately 30,000 driver visas were revoked — tightening cabotage capacity and directly accelerating the market’s supply-led recovery. Marten Transport gave the fullest account of the mechanism at work: non-domiciled CDL enforcement, English Language Proficiency requirements, ELD-fraud crackdowns, CDL mill closures, and “chameleon carrier” enforcement, all reinforced by the Montgomery v. Caribe Transport II broker-liability ruling.
That last piece is doing real work in the market. Landstar disclosed that its approved third-party carrier base has shrunk to roughly 64,000 — down 35% from more than 100,000 in Q2 2022 — framing the reduction explicitly through a liability-risk lens as brokers and shippers consolidate onto higher-quality, better-insured capacity in the wake of the ruling.
“We expect carrier capacity to continue leaving the market with the full enforcement of the FMCSA Final Rule on non-domiciled CDLs.”— RXO management, Q2 2026
Why aren’t large fleets just adding trucks?
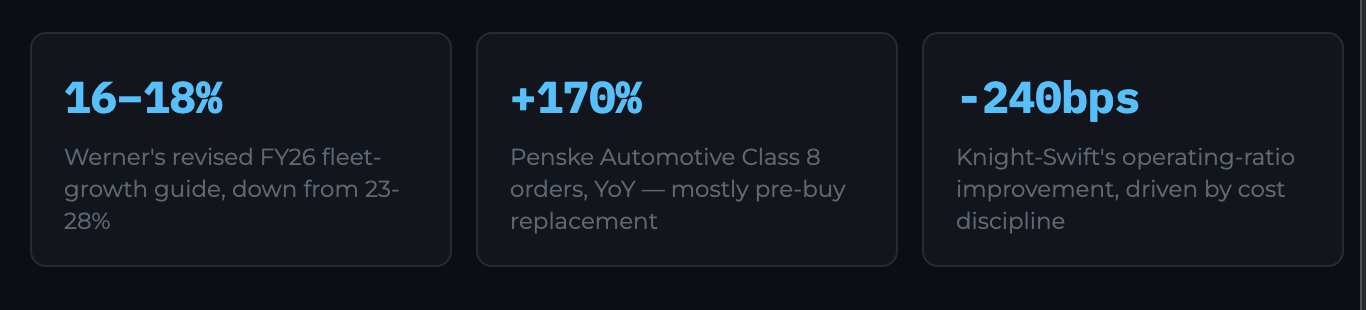
This is the part of the story that’s easy to miss if you only track headline Class 8 order data. Orders are up sharply — Penske Automotive’s Class 8 orders surged 170% year-over-year — but that surge is concentrated in EPA 2027 pre-buy activity: fleets replacing aging tractors ahead of the January 2027 emissions standard, not expanding net capacity. Trailer demand tells the real story — Wabash National’s trailer volumes remain weak, confirming fleets are swapping tractors, not growing fleets.
Large carriers are choosing a different lever entirely: utilization and margin. Werner Enterprises cut its full-year fleet-growth guidance to 16-18%, down from a prior 23-28% target, explicitly citing productivity gains and slower hiring rather than lost opportunity. J.B. Hunt described its own growth as “growing into prefunded capacity investments” — using the network it already has more efficiently — rather than adding trucks. Knight-Swift’s operating ratio improved 240 basis points largely on cost discipline, and Ryder posted its seventh consecutive quarter of comparable EPS growth on used-vehicle pricing and utilization, not fleet expansion.
So how early are we, really?
By SONAR’s own cycle-stage tracking, several of the structural pieces of this recovery are still in progress, not finished. Bid-season contract repricing is only an estimated 40% complete, with the second half expected to bring larger increases. EPA 2027 pre-buy in OEM order books is roughly 55% complete. Air cargo capacity tightening — a genuinely new theme this quarter, confirmed independently by DHL, Kuehne+Nagel, Expeditors, and DSV — is only about 35% complete, meaning it’s just getting started as a cross-modal pressure point. None of this reads like a cycle that has already played out.
What this means if you’re shipping or hauling freight right now

- Contract rates are lagging spot for a reason. Spot mix at brokers like RXO hit 42% of volume this quarter, a 900-basis-point sequential jump — that gap tends to close as bid season progresses, not stay open.
- Don’t mistake pre-buy order surges for fleet growth. Class 8 order strength is about replacing equipment ahead of 2027 emissions rules, not carriers expanding capacity to chase freight.
- Watch enforcement, not headcount. The capacity story this cycle is regulatory and structural — CDL enforcement, English-proficiency rules, broker-liability exposure — which behaves differently than a cyclical demand swing and is unlikely to reverse quickly.
Frequently asked questions
- Is the freight market recovering in 2026?
- Yes, but it’s still early. Q2 2026 earnings show pricing and tender rejections rising faster than volume — a supply-driven recovery led by capacity leaving the market, with several key cycle stages still only 40-55% complete.
- Why is trucking capacity tightening in 2026?
- Regulatory enforcement, not a driver shortage. Non-domiciled CDL enforcement, English-language-proficiency rules, CDL mill closures, and the Montgomery v. Caribe Transport II broker-liability ruling are pushing marginal capacity out of the market. Schneider disclosed roughly 30,000 driver visas revoked this quarter alone.
- Are large trucking fleets adding trucks in 2026?
- Mostly no. Werner cut its fleet-growth guidance to 16-18% from 23-28%. Large carriers are prioritizing utilization and operating-ratio improvement over fleet expansion, and much of the Class 8 order surge is EPA 2027 pre-buy replacement rather than net growth.
- What is the Montgomery v. Caribe Transport II ruling?
- A broker-liability ruling that raised legal exposure for negligent hiring of unsafe carriers. It’s accelerating consolidation onto higher-quality, better-insured capacity — Landstar’s approved carrier base is down 35% from its Q2 2022 level.
- Where can I access the full SONAR Q2 2026 Freight Earnings Blue Book?
- Inside the SONAR platform for enterprise subscribers, or via FreightWaves Market Monitor at getfreightdata.com. Request a demo to learn more about SONAR access.
Access the full Q2 2026 Blue Book
All Sitreps, including the full 66-company Q2 2026 Freight Earnings Blue Book, can be accessed in the SONAR platform for enterprise subscribers, or via FreightWaves Market Monitor at getfreightdata.com. To learn more about SONAR, request a demo below.