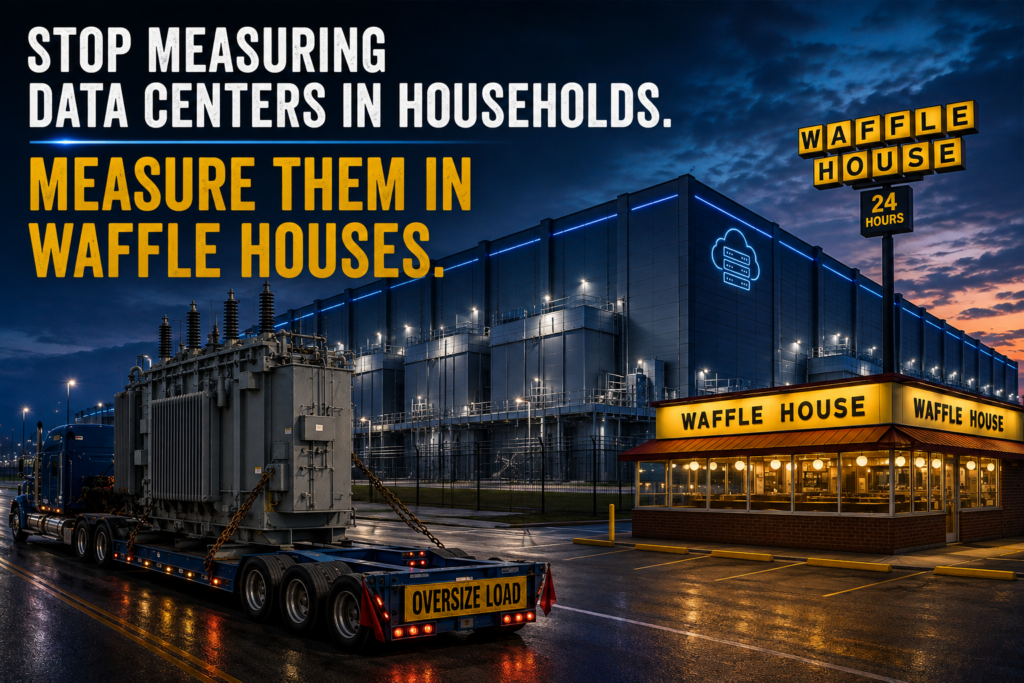
The buildout is already a freight story
Long before a single GPU lights up, a hyperscale data center is a freight problem. Nearly 100 gigawatts of new data center capacity is expected to come online globally between 2026 and 2030, roughly doubling current supply, at a compound annual growth rate of about 14% through the end of the decade, according to reporting on the construction logistics behind the buildout. Estimates put total infrastructure spending tied to that buildout at around $3 trillion by 2030, with roughly $1.2 trillion of that tied directly to construction. Every megawatt of that capacity has to arrive as generators, switchgear, cooling systems, and transformers, sourced globally, sequenced tightly on site, and often subject to 18-to-24-month lead times for the critical electrical gear.
That’s already showing up in freight and logistics data. Industrial real estate construction was up 18% in a recent quarter, driven substantially by data centers competing with retail and e-commerce for warehouse space and general contractor capacity. It shows up in SONAR’s own freight data, too, in the equipment type that hauls generators, transformers, switchgear, and structural steel: flatbed. The SONAR Flatbed Truckload Index (FTI.USA) averaged $2.72 a mile in the second quarter of 2025 and $4.12 a mile in the second quarter of 2026, up 52% year over year, and the SONAR Truckload Rejection Index – Flatbed (STRIF.USA) — the share of flatbed tenders carriers turn down, a standard proxy for how tight capacity is — rose from an average of 22.7% to 37.2% over the same comparison, up 64%.
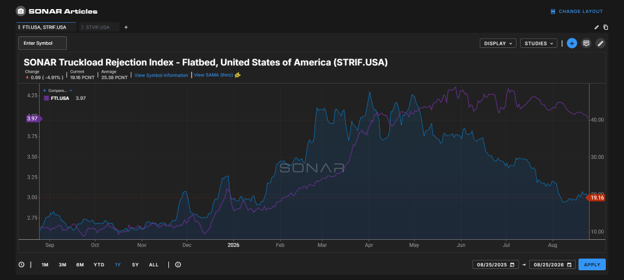
SONAR Tickers: FTI.USA, STRIF.USA
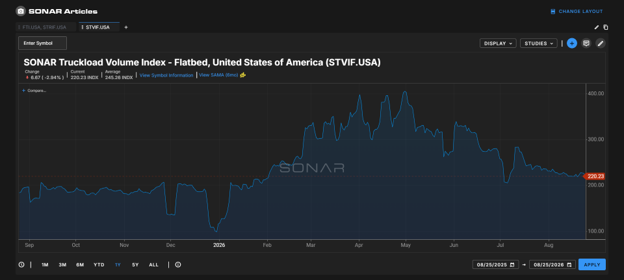
That’s not carriers simply exiting the flatbed market: the SONAR Truckload Volume Index – Flatbed (STVIF.USA) rose 46% year over year over the same quarter, so rates and rejections climbed alongside demand, not because supply quietly shrank. Flatbed rates move with plenty of things besides data centers — energy projects, infrastructure spending, and seasonal agricultural freight all show up in this index — so this isn’t proof of a single cause, but the timing and the magnitude line up with the buildout described above. Freight brokerages have flagged capacity tightening tied to the same dynamic. In short: AI capital spending has become a first-order variable in freight capacity planning, not a footnote.
If you work in freight, logistics, or infrastructure siting, you eventually have to answer the question every executive and every reporter asks: how much power does one of these things actually use? And that’s where the public conversation starts to go sideways.
The problem with measuring data centers in “households”
The default unit of comparison, in Congress and in the press, is the household. The Congressional Research Service’s (“CRS”) own explainer on data center energy consumption, Data Centers and Their Energy Consumption: Frequently Asked Questions (R48646), frames it this way: a 100 MW data center draws enough power to “support the electricity needs of 80,000 U.S. households,” and new hyperscale facilities in the 100–1,000 MW range are equivalent to the load of 80,000 to 800,000 homes. The same report notes that one large AI model training run consumed about 50 gigawatt-hours, “enough to power San Francisco for three days,” and that U.S. data centers used roughly 176 terawatt-hours in 2023, or about 4.4% of total U.S. electricity consumption.
As an economist, not an electrical engineer, I don’t feel qualified to question the validity of the Congressional estimates. However, comparing 10,000 square foot hyperscalers to the common 2,000 square foot household does not seem like an apples-to-apples comparison, and looking at the propriety of next-best-options and benchmarks is right in the economist’s wheelhouse.
A household is a questionable benchmark for a data center for two reasons that both point the same direction. First, load factor: a home’s electricity draw swings wildly across the day, spiking at breakfast and dinner and idling most of the rest of the time, with a peak-to-average ratio far above 1. A data center, by contrast, runs close to its full nameplate capacity nearly around the clock — that’s the entire point of the CRS’s own household-equivalent math, which works only if you assume the facility is drawing its stated MW figure continuously, 24 hours a day, 365 days a year. You can check this yourself: 100 MW run flat-out for a full year comes to 876 million kWh, and 876 million kWh divided by the EIA’s average residential customer usage of 10,791 kWh per year is about 81,200 households — almost exactly the CRS’s “80,000” figure. So the CRS is implicitly comparing an always-on industrial load to a bundle of intermittent, low-load-factor residential ones and calling it a household equivalent. That’s an apples-to-almost-nothing comparison dressed up as apples-to-apples.
Second, scale and kind: a household isn’t a commercial enterprise, doesn’t compete for construction labor or transformers, and gives a freight analyst or capacity planner nothing to reason with. If you want the comparison to be useful to the people actually building, siting, and supplying these facilities, you want a benchmark that is itself a business: something widespread and frequently seen by a large portion of the population, something with high energy use per square foot, something that — outside of the hyperscale campuses themselves — runs small, and something that, like a data center, never really closes.
That describes exactly one instantly recognizable American institution: Waffle House.
Why Waffle House is the right yardstick
This isn’t just wordplay — a federal agency already treats Waffle House’s operating status as a real measurement instrument. The so-called “Waffle House Index,” popularized around 2011 by then-FEMA Administrator Craig Fugate, is an informal green/yellow/red scale — green for full menu service, yellow for a limited menu, red for closed — that emergency managers use alongside formal damage assessments when gauging how hard a community has been hit, as Snopes’ fact-check of the claim explains in detail. It works as a signal precisely because the chain is made up of so many small, densely distributed, always-open locations: as Fugate put it, “If you get there and the Waffle House is closed? That’s really bad.” FEMA is already using this chain as an instrument. I’m just borrowing the instrument for a different measurement.
The underlying reason it works as an instrument is the same reason it works for us: Waffle House restaurants are small, energy-dense, and never close. Five Texas state construction and accessibility permits for new Waffle House locations, filed in different cities — including Dallas, Round Rock, and Missouri City — between 2019 and 2022, put their footprint at 1,659, 1,689, 1,689, 1,694, and 1,760 square feet — averaging about 1,700 square feet, which is what I’ll use below.
What makes that sample useful isn’t just the average, it’s how tightly it clusters. The full range, 1,659 to 1,760 square feet, spans only 101 square feet — under 6% of the mean, with a coefficient of variation of about 2%. That’s a remarkably tight distribution for a real-world commercial construction sample built by different contractors in different cities across several years; it’s closer to the tolerance you’d expect from a standardized physical unit, like a shipping container or a parking space, than from a bespoke restaurant build. That consistency is exactly what makes Waffle House usable as a yardstick rather than just a punchline: the unit doesn’t wobble much depending on which location you happen to sample.
That ~1,700-square-foot building is tiny by commercial standards, but it runs a continuously-hot flat-top grill, waffle irons, walk-in and reach-in refrigeration, full kitchen exhaust ventilation, and lighting and signage, 24 hours a day, 365 days a year, with no seasonal or overnight shutdown. It is, in miniature, the same profile as a data center: small footprint, high power density, and a load factor close to 1, meaning nearly constant, steady usage.
Waffle House itself doesn’t publish utility data — it’s 100% company-owned, so there’s no franchise disclosure document to pull numbers from. Therefore, the estimate below is built from public data sources, not an official disclosed Waffle House number.
The data and the math
The math draws on four public data points:
- U.S. Energy Information Administration, 2018 Commercial Buildings Energy Consumption Survey (CBECS), Table C14 — electricity consumption and intensity by building activity. The “Food service” category averages 43.8 kWh per square foot per year.
- CBECS 2018 Table C24 — natural gas consumption and intensity by building activity. “Food service” averages 147.6 cubic feet per square foot per year, which at EIA’s standard natural gas heat content of 1,037 Btu per cubic foot works out to 153,061 Btu per square foot per year.
- CBECS 2018 Table B15 — building activity subcategories, including hours of operation. “Food service” buildings average 81 hours of operation per week.
- The five Texas Department of Licensing and Regulation (TDLR) accessibility/construction permits already cited above, averaging ~1,700 square feet.
Here’s the walk-through. Convert both fuels to Btu per square foot per year: electricity’s 43.8 kWh becomes 149,446 Btu (at 3,412 Btu/kWh), and gas contributes 153,061 Btu, for a combined 302,507 Btu per square foot per year for a typical food-service building operating its typical 81 hours a week.
Divide that by the annual hours the average food-service building is actually open (81 hours/week × 52.14 weeks = 4,224 hours/year) to get an hourly rate: about 35.4 Btu/hour/sq ft from electricity and 36.2 Btu/hour/sq ft from gas. This step assumes essentially all of a typical restaurant’s annual energy use happens while its doors are open — a simplification, since refrigeration and security lighting don’t fully shut off overnight, so it’s a slightly generous rate. Multiply that hourly rate out across all 8,760 hours in a year — because Waffle House, unlike the average food-service building, is always open — and the per-square-foot intensity roughly doubles: 309,961 Btu/sq ft/yr from electricity and 317,460 Btu/sq ft/yr from gas, for a combined 627,422 Btu per square foot per year.
That’s 2.38 times the 263,300 Btu/sq ft/yr that EIA itself cites as the food-service-building average in its “Food service buildings are highly energy intensive” write-up. That 2.38x multiplier cleanly splits into two independent factors: a 1.15x fuel-mix effect (our electricity-plus-gas total of 302,507 Btu/sq ft/yr already runs 15% above EIA’s population-wide 263,300 figure, because that headline number blends in all-electric restaurants with no gas load at all, while a griddle-cooking, 24-hour diner like Waffle House is squarely in the gas-using group) and a 2.07x hours-of-operation effect (from stretching 81 open-hours-a-week to a full 168). Multiply those together — 1.15 × 2.07 — and you land back on 2.38.
Converting 627,422 Btu/sq ft/yr to electrical-equivalent terms (dividing by 3,412 Btu/kWh) gives 183.9 kWh per square foot per year. Scaled to a roughly 1,700-square-foot Waffle House, that’s about 312,600 kWh per year — or about 857 kWh a day, or a continuous average draw of roughly 35.7 kW, electricity and gas combined and converted to a common electrical-equivalent basis.
Data centers, in Waffle Houses
With that yardstick in hand, the comparisons in the Congressional numbers look different.
A single Waffle House’s ~312,600 kWh a year is worth about 29 households by EIA’s 10,791-kWh average — already a sense of how much a small, always-on commercial operation dwarfs a home. But stack it against data centers, and the real comparison set comes into focus. A small data center (roughly 1–5 MW, per industry sizing conventions) running near full nameplate capacity uses somewhere between 28 and 140 Waffle-House-equivalents worth of electricity a year. A mid-size enterprise facility (5–20 MW) runs 140 to 560 Waffle Houses. A large hyperscale facility at the 20–100 MW mark that CRS uses as its benchmark comes in at 560 to roughly 2,800 Waffle Houses — and that upper bound, 100 MW, is the exact facility size CRS compares to 80,000 households.
Named hyperscale projects push the comparison further into absurdity for the household framing, and further into usefulness for ours. The Vantage “Lighthouse” campus in Wisconsin, part of the Stargate buildout, is sized at 902 MW of IT capacity — about 25,300 Waffle-House-equivalents, or 732,000 households. Stargate’s full planned buildout, up to 10 GW across all phases, works out to roughly 280,000 Waffle Houses, or a bit over 8 million households. A single large AI model training run, the 50-gigawatt-hour example CRS uses (“enough to power San Francisco for three days”), is the equivalent of about 160 Waffle-House-years of electricity, or a Waffle House running for 160 years straight. All U.S. data centers combined, the 176 terawatt-hours CRS cites for 2023, comes out to roughly 563,000 Waffle Houses’ worth of annual power.
None of these swaps changes the underlying physics or the policy stakes — data centers are large, growing loads on the grid, full stop. I’m not saying that data centers don’t have significant considerations: that much is obvious based on what the data has shown thus far. How significant those considerations are depends on the benchmark you use. “Enough to power 80,000 homes” measures an always-on industrial load against a bundle of intermittent, low-density ones — a comparison across kinds of consumption, not just across scale, and one that doesn’t actually tell you whether a given facility’s draw is ordinary or extraordinary for a business built the way it’s built. “Enough to run 2,800 Waffle Houses” is a comparison within kind: another small, continuously-operating commercial load, so the multiple you get back reflects scale rather than a mismatch in how the two loads behave over a day — the same small, energy-dense, always-on commercial profile, just repeated at a scale that, outside the hyperscalers, doesn’t exist anywhere else in the American built environment. That’s what the better benchmark buys you: not a bigger number or a smaller one, but a number you can actually trust to mean what it says. For the freight and infrastructure planners tracking where the next transformer, generator, or cooling unit needs to move, that’s the more useful starting point.