China’s exports to the United States look almost untouched this year — departed ocean volume is down just 0.53% year-over-year, a rounding error in a market this size. Look one step further down the supply chain, though, and a very different picture shows up.
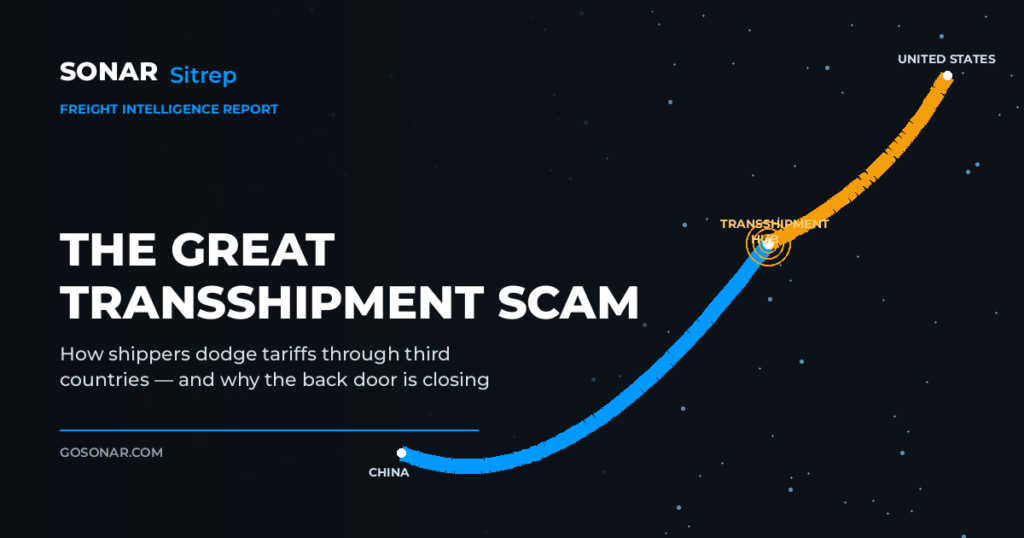
That’s the starting point of SONAR’s newest SitRep, The Great Transshipment Scam, which uses SONAR’s ocean lane, commodity-level HS code, and tender-rejection data to test the White House’s new transshipment enforcement report against real freight movement — country by country and product by product.
Key Takeaways
- China’s direct line to the U.S. is flat — the real movement is one hop away. China’s shipments into Vietnam, Indonesia, Malaysia, Thailand, Cambodia, and Singapore are all up 30–50% year-over-year, even as its direct-to-U.S. volume hasn’t moved. That’s the first leg of the two-leg journey transshipment enforcement is designed to catch.
- Wood and furniture into Vietnam is the clearest commodity-level match. Wooden picture frames (HS 4414) shipped from China into Vietnam are up 102.65% year-over-year, and the same product shipped from Vietnam to the U.S. is up 278.57% over the same window — a matched surge on both legs that lines up directly with a real CBP enforcement case involving Vietnam-relabeled Chinese timber.
- Vietnam is the consistent common thread, not Southeast Asia broadly. Of five commodity categories SONAR checked against the country-level pattern, Vietnam showed a matched two-leg signature in four. No other country in the region matched in more than one.
- Enforcement is shifting from case-by-case to systemic. A new 40% penalty duty on transshipped goods, an AI-powered inspection system CBP calls “Detective Border,” tighter rules of origin, and real collateral requirements on importers together represent a structural change in how transshipment gets caught.
- The pattern doesn’t always hold — and that’s the point. Apparel and textiles, the highest-volume category with the single biggest tariff incentive, shows the opposite signature: China-origin volume into Vietnam and Cambodia rising while both countries’ apparel exports to the U.S. fell. A pattern that shows up in some categories and not others is more credible than one that shows up everywhere.
Why This SitRep Exists
The White House’s new “Great Transshipment Scam” report puts a $75 billion estimate on goods routed through third countries to dodge U.S. tariffs on Chinese-origin products — but the administration’s own figures are explicitly framed as model-based illustrations, not observed counts. Country-level trade data alone can’t tell you whether that estimate holds up, because rising import volume from Vietnam or Malaysia is equally consistent with legitimate manufacturing relocation and with disguised transshipment.
This SitRep goes one level deeper using SONAR’s commodity-level ocean data, checking whether the same product spikes on both the China-in leg and the U.S.-out leg, in the same country, at the same time — a much harder pattern to fake than aggregate volume. It walks through five product categories, what matched and what didn’t, and what the divergence between customs-reported origin data and SONAR’s observed volume and rejection patterns is likely to show as enforcement tightens.
Read the Full SitRep
The complete report — the full country-by-country and commodity-by-commodity data, SONAR dashboard screenshots, and the freight market implications for carriers and brokers on Asia-linked import lanes — is available now:
- SONAR Platform subscribers: Find it under Research in the SONAR Platform. Included for all enterprise subscribers.
- Self-serve access: FreightWaves Market Monitor also carries SONAR SitReps as individual research unlocks, with self-serve subscription plans starting at $199/month at getfreightdata.com.
Frequently Asked Questions
What is the “Great Transshipment Scam”? It’s the name the White House Office of Trade and Manufacturing Policy gave its August 2026 report on goods manufactured in China, routed through a third country for minimal processing or relabeling, then re-exported to the U.S. under a lower-tariff declared country of origin. The report estimates roughly $75 billion in illegally transshipped goods moved this way between February 2025 and February 2026, and names more than 40 countries as conduits.
How does tariff transshipment actually work? In its illegal form, goods made in China are shipped to a third country where they undergo relabeling, repackaging, or token processing that doesn’t meaningfully change the product, then get re-invoiced and re-exported to the U.S. under that third country’s lower tariff rate. It’s distinct from legal transshipment, where genuine manufacturing or component assembly in the third country legitimately changes the product’s country-of-origin status.
Which countries are most exposed to transshipment risk? The White House report sorts more than 40 countries into risk tiers based on their trade integration with China and structural vulnerability to rerouting. Vietnam, Malaysia, Cambodia, and Indonesia have absorbed the bulk of Southeast Asia’s China-origin re-routing since 2018. SONAR’s ocean data shows China’s shipments into all four of these countries up 30–50% year-over-year, even as China’s direct shipments to the U.S. stayed flat.
What is CBP’s “Detective Border” system? Detective Border is an AI-enabled inspection system U.S. Customs and Border Protection is building to risk-score transshipment likelihood for cargo on every vessel leaving every port bound for the U.S., before it arrives rather than after. It’s paired with a new 40% penalty duty on goods determined to be transshipped, tighter rules-of-origin requirements, and real collateral requirements on importers.
Does the data show which products are most likely to be transshipped? Yes. SONAR’s commodity-level ocean data shows wood and furniture products (HS codes 44 and 94) moving into Vietnam from China and out to the U.S. in a matched surge on both legs — the clearest signature in the data, and one that lines up with a real CBP enforcement case. Apparel and textiles, by contrast, show the opposite pattern, which is a useful reminder that not every high-tariff category fits the transshipment story.
This Sitrep is based on FreightWaves reporting, White House Office of Trade and Manufacturing Policy, “The Great Transshipment Scam” (Aug. 13, 2026); Fortune; Bloomberg; Business Standard; SONAR production dashboard and MCP data.
Request a SONAR demo to see how SONAR tracks the freight market signals behind stories like this one.