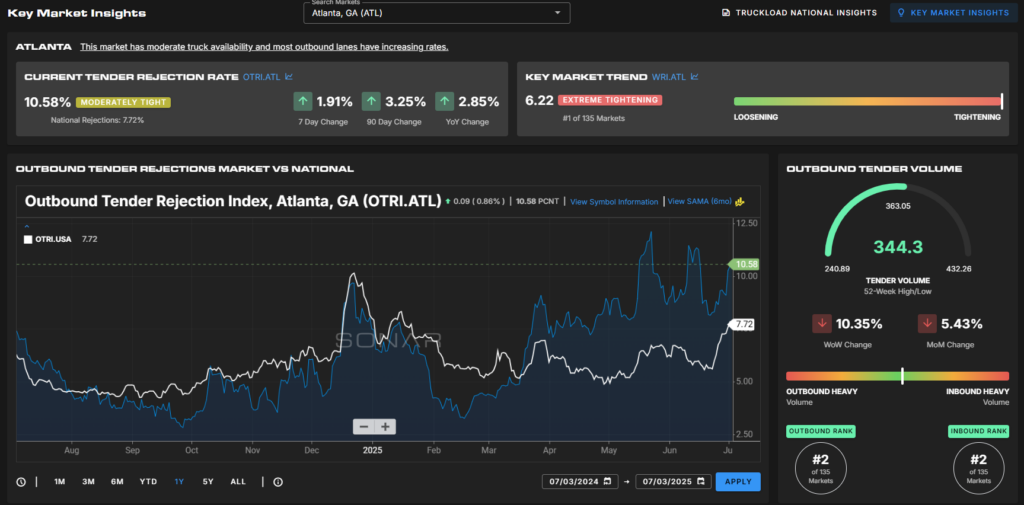
The Weighted Rejection Index (WRI) combines market volume with the volatility of short-term rejection rates. It provides analysts with an efficient way to identify which markets are undergoing the most significant changes in truckload tender rejections compared to others across the country.
An increase in the rejection rate in a small market has a different impact than the same increase in a larger market. For example:
In the Erie, Pennsylvania market, the Outbound Tender Rejection Index (OTRI) rose from 10.98% on January 19 to 17.64% on January 26, an increase of 666 basis points.
During the same week, Houston’s OTRI increased from 2.99% to 4.31%, or 132 basis points.
While Erie appears to face a larger tender rejection issue, the smaller market size causes more pronounced fluctuations in OTRI.
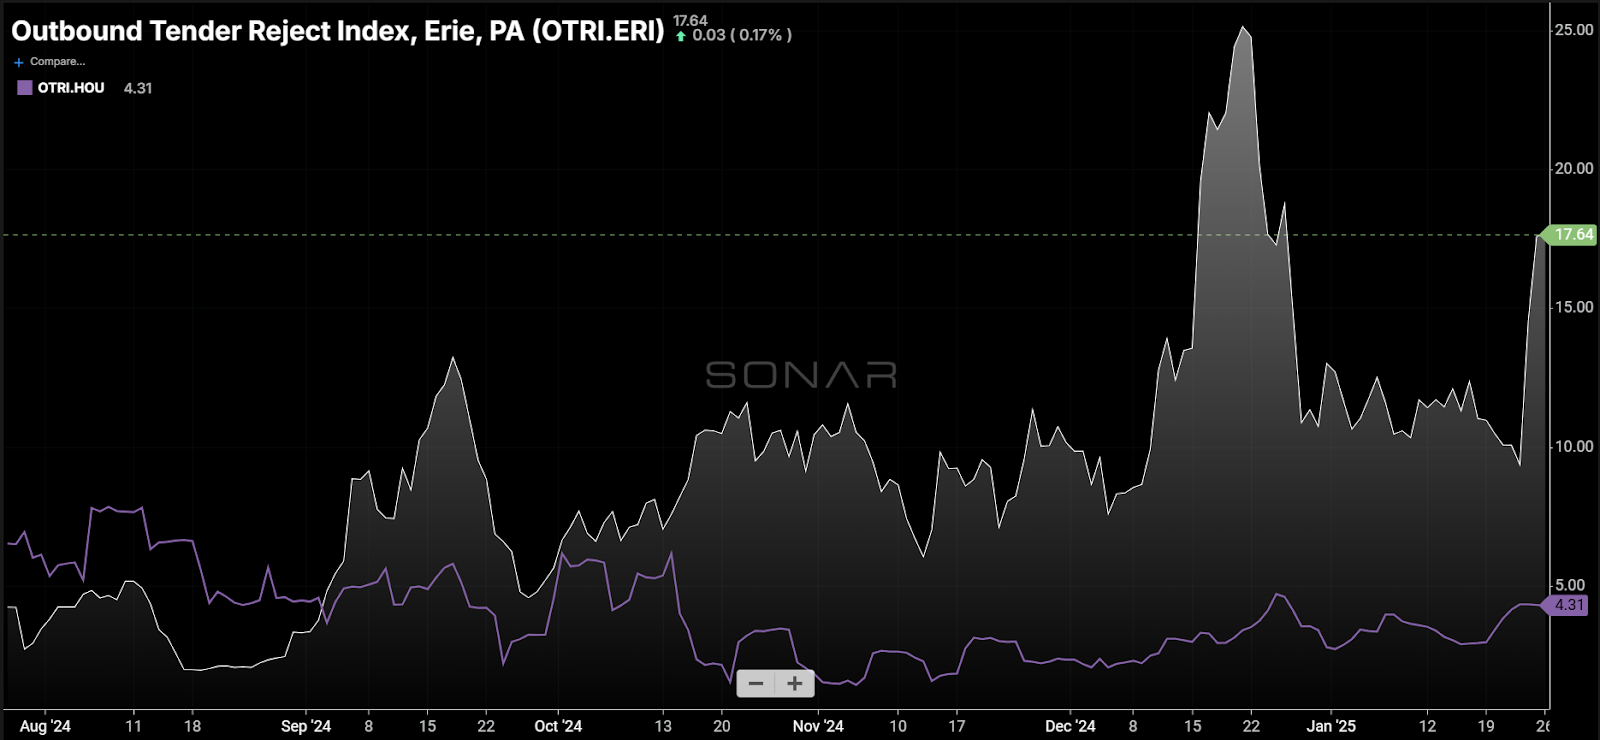
The Erie market accounted for only about 0.14% of total outbound tender volume in the U.S. that week, whereas Houston represented approximately 2.9%. Considering rejection rate changes alone doesn’t provide the best insight into where capacity conditions are changing most significantly. To address this, the WRI “weights” rejection rate changes with market volume, helping prioritize areas requiring attention.
The WRI Formula:
The formula is straightforward:
Outbound Tender Market Share (OTMS) × Weekly Change in Tender Rejection Rate
Using the earlier example:
Erie WRI = 0.14 × 6.66 = 0.932
Houston WRI = 2.9 × 1.32 = 3.828
From a transportation management perspective, Houston poses a greater potential issue for businesses operating in both markets. Similarly, for 3PLs or brokers, Houston offers more opportunities or challenges compared to Erie. In short, the WRI helps prioritize efforts to address capacity-related problems and highlights where the most urgent service needs exist across the U.S.
What is a Meaningful WRI Value?
The WRI was developed by FreightWaves/SONAR market experts to identify markets with the highest relevance for their customers on a week-to-week basis. It’s a short-term metric designed for tactical decision-making, though it can also reveal long-term trends when evaluating market volatility over time.
Generally, most markets have WRI values between -2 and 2. However, this range was significantly exceeded during the pandemic years of 2020–2022, demonstrating that exceptions do occur.
Visualizing WRI with a Heat Map:
A heat map is the most effective way to view WRI values, as it allows users to quickly identify markets with the most significant changes over the past seven days. In SONAR, tightening markets are shown in dark blue, while loosening markets appear in shades of orange.
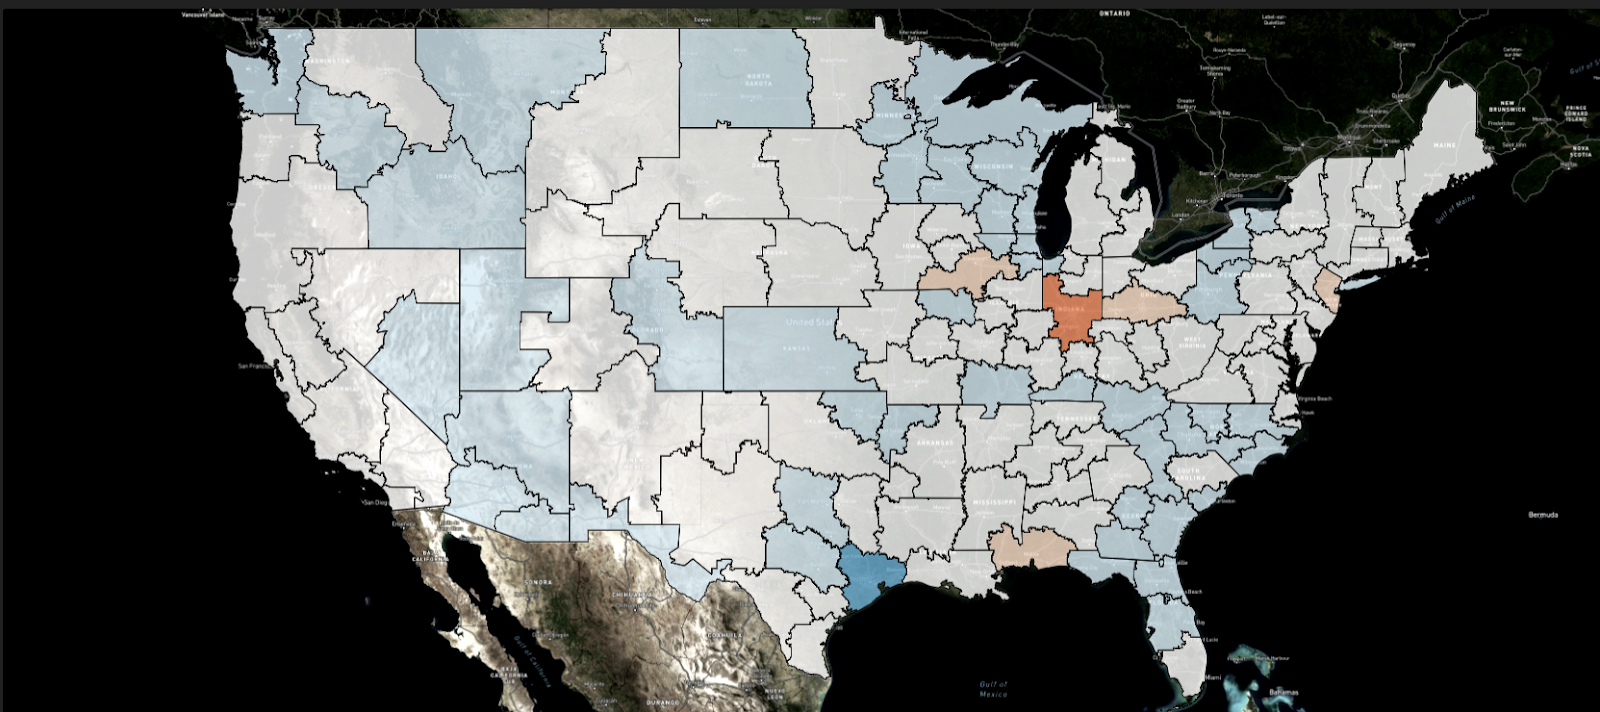
For instance, on January 26, 2024, Houston had the highest WRI value in the U.S., while Indianapolis had the lowest.
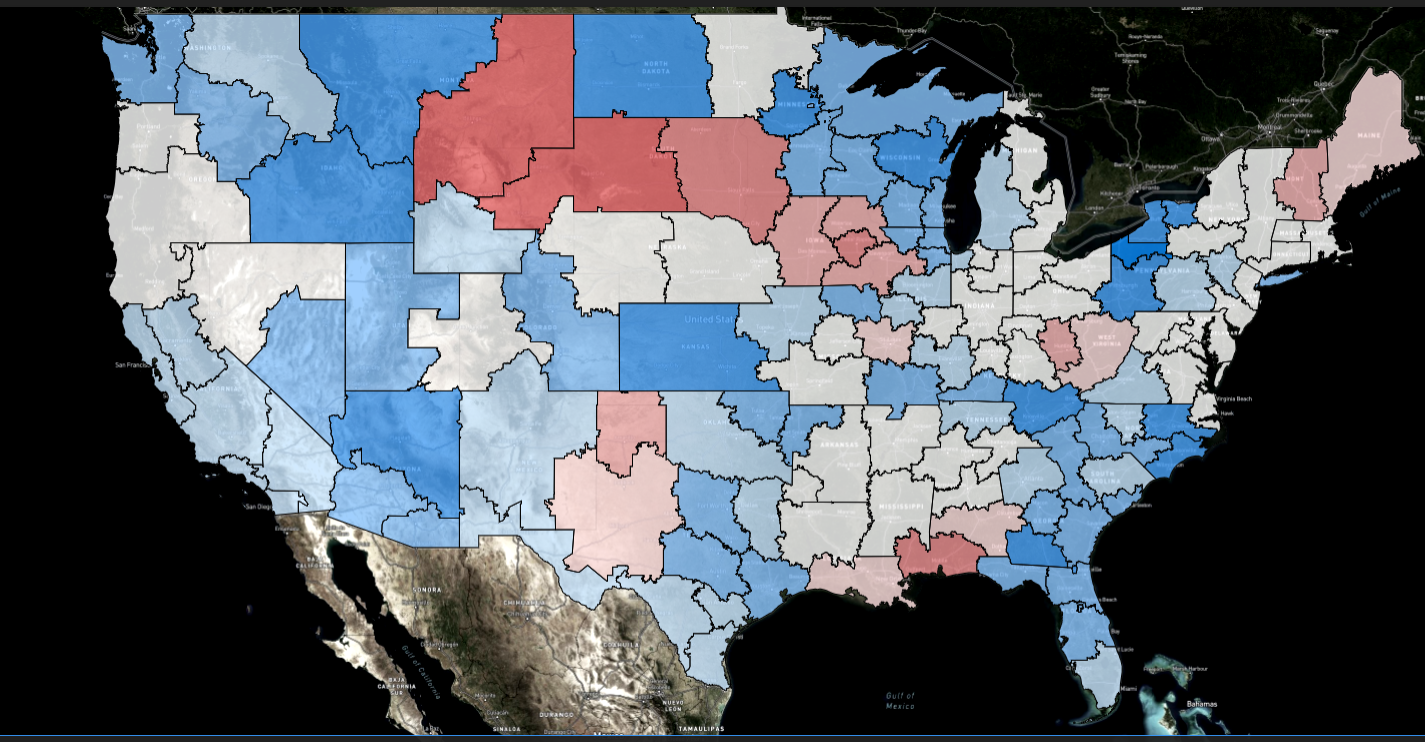
When examining a heat map of weekly changes in tender rejection rates for the same day, the insights differ, as it focuses solely on OTRI value changes. While this view has value, it doesn’t offer the same prioritization clarity as the WRI.
The Weighted Rejection Index (WRI) is a powerful tool for identifying and prioritizing areas of interest in the dynamic truckload market. By combining tender rejection rate changes with market volume, the WRI provides a clearer picture of where capacity conditions are shifting most significantly. Whether you’re a transportation manager, broker, or analyst, the WRI offers actionable insights to focus efforts on regions with the greatest impact on operations or opportunities. As market conditions continue to evolve, leveraging tools like the WRI ensures a proactive approach to navigating the complexities of freight management.