In today’s dynamic freight environment, the ability to interpret transportation market signals is essential for maintaining strong carrier relationships and operational efficiency. Shipper Key Market Insights—such as rejection rates, freight volumes, and regional balance—can help proactively address challenges and guide critical decisions. Here are three strategic ways shippers can use this data to their advantage.
1. Addressing Carrier Compliance in Strong Freight Markets
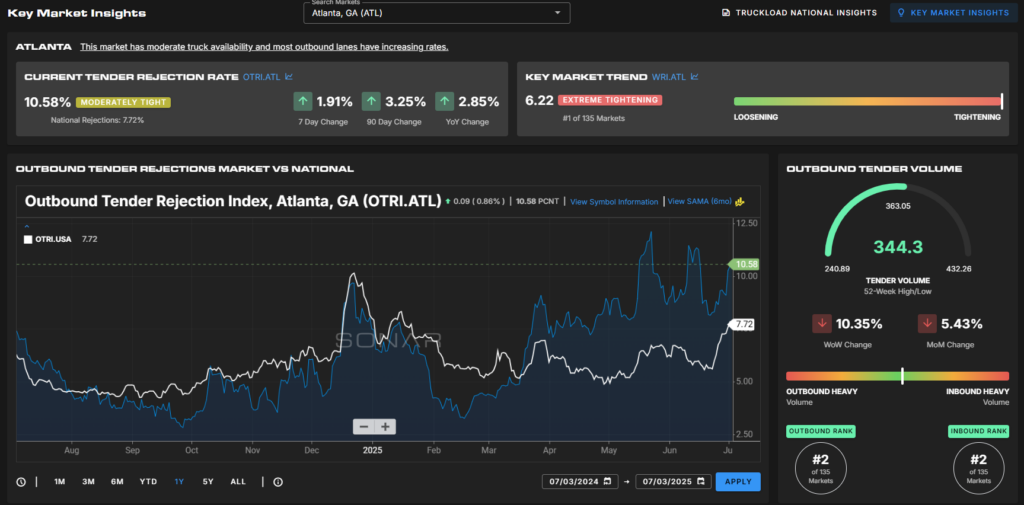
Even when contracts are in place, shippers may notice primary carriers failing to accept tenders. This often occurs in strong freight markets where outbound volume is high and capacity tightens. Key indicators like an elevated Outbound Tender Rejection Index (OTRI) signal that carriers have more freight options and are prioritizing higher-paying or more favorable loads.

What this means:
If your contracted rates are less competitive or your freight is less desirable, you may be deprioritized—leading to increased spot market reliance or service delays. Proactively monitoring rejection trends and volume surges in key shipping regions can help adjust rates, renegotiate terms, or source additional carrier options before compliance issues escalate.
2. Navigating Low-Volume or Structurally Weak Markets
In contrast, weak or low-density markets can present a different kind of challenge. Even when rejection rates are low, low outbound and inbound volume may indicate limited carrier presence and fewer routing opportunities. These conditions make it difficult for carriers to position equipment cost-effectively, especially when sudden volume spikes occur.

What this means:
When working in these structurally weak markets, it’s vital to plan for limited capacity flexibility. Building proactive pricing mechanisms—like surge rates or volume-based escalators—can safeguard service levels. Additionally, maintaining visibility into local market trends enables better planning around promotional periods or seasonal fluctuations.
3. Evaluating Markets for Network Optimization and Warehouse Shifts
During distribution network redesigns or warehouse relocations, transportation cost and carrier availability are often overlooked. Market density and balance—the flow of freight in and out of a region—can make or break the success of a new location. High-volume, well-balanced markets offer abundant, cost-efficient carrier capacity. In contrast, smaller or unbalanced markets may require carriers to reposition trucks, increasing both cost and service risk.

vs

What this means:
When evaluating warehouse relocations, it’s not enough to compare real estate or labor costs. Incorporate market insight tools to assess carrier presence, freight volumes, and rejection trends in both the origin and destination markets. If you’re considering a move to a thinner market, make sure you either control inbound freight or budget for higher transportation costs to offset repositioning needs.
Final Thoughts
Key Market Insights equip shippers with the knowledge to better understand why service disruptions happen, how markets respond to volume changes, and where long-term risks may lie. By leveraging this data, shippers can develop smarter strategies for contract negotiations, capacity planning, and network design—ultimately leading to more resilient and cost-effective supply chains.