Volumes drop significantly to start month; tender rejection rates back below 6%
This week’s FreightWaves Supply Chain Pricing Power Index: 40 (Shippers)
Last week’s FreightWaves Supply Chain Pricing Power Index: 40 (Shippers)
3-month FreightWaves Supply Chain Pricing Power Index Outlook: 40 (Shippers)
The FreightWaves Supply Chain Pricing Power Index uses the analytics and data in FreightWaves SONAR to analyze the market and estimate the negotiating power for rates between shippers and carriers.
This week’s Pricing Power Index is based on the following indicators:
Reefer volumes plummet to start February
The freight market is facing seasonal pressures to kick off February. The decline in tender volumes to begin the month isn’t unexpected but is happening later than in previous years. What will be interesting to see is whether there is any positive momentum at the end of the month or if there will be continued headwinds.

SONAR: Outbound Tender Volume Index — Seasonality View: 2025 (white) 2024 (green) and, 2023 (pink)
The Outbound Tender Volume Index (OTVI), a measure of national freight demand that tracks shippers’ requests for trucking capacity, dropped over the past week as February is off to a sluggish start. Over the past week, the OTVI fell by 3.25%, a sizable decline after recovering from the Martin Luther King Jr. Day holiday. Compared to this time last year, tender volumes are down 4%.
The end of February and early March are when to find the next opportunity for positive momentum as the early stages of produce start moving and Lunar New Year pull-forward freight arrives stateside. The question will be how much of the pull-forward freight enters the truckload market, moves inland via intermodal or is moved to warehouse facilities in and around port markets.
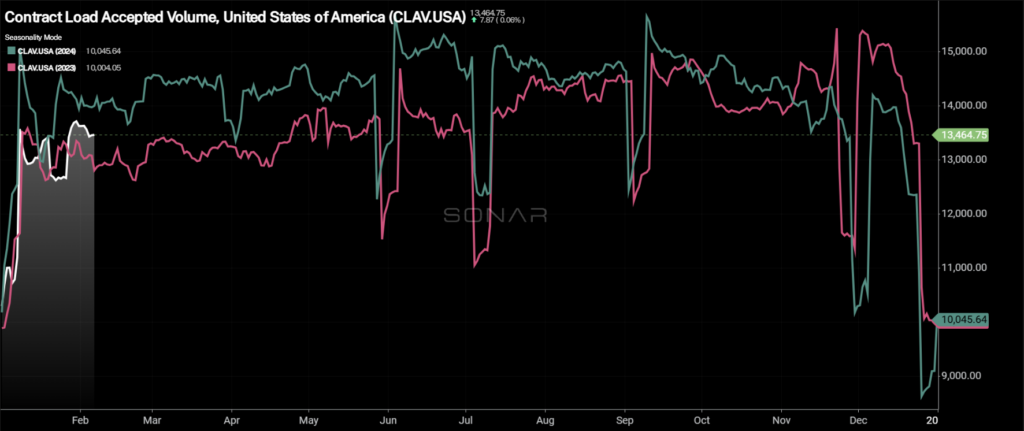
SONAR: Contract Load Accepted Volume — Seasonality View: 2025 (white), 2024 (green) and 2023 (pink)
Contract Load Accepted Volume (CLAV) is an index that measures accepted load volumes moving under contracted agreements. In short, it is similar to OTVI but without the rejected tenders. Looking at accepted tender volumes, the decline was less severe than the overall OTVI as tender rejection rates experienced a fairly significant decrease in their own right. Over the past week, accepted volumes fell by 1.83% and are down 4.85% y/y.
Bank of America’s most recent card spending report showed that growth in spending is slowing. In the most recent week for which data is available, the week ending Feb. 1, total card spending was up 0.9% y/y, though excluding autos, spending was down 0.3%. Furniture and home improvement were drags on spending, currently down 4.3% and 3.7% y/y, respectively.

SONAR: Outbound Tender Volume Index — Weekly Change
A sluggish start to February from a volume perspective was felt across the vast majority of the country the past week. Of the 135 markets tracked within SONAR, 48 reported higher volumes over the past week, down from 104 last week.
Despite being shaded white in the map above, the Dallas and Atlanta markets experienced fairly significant drops in tender volumes over the past week, falling by 7.66% and 7.22%, respectively. Additionally, Ontario, California, the largest freight market in the country, saw tender volumes drop by 2.09% week over week.
It wasn’t all negative in the largest markets. The Chicago market continues to see some positive signs as tender volumes grew by nearly 2%.
While most of Southern California felt lower volumes, the Fresno market saw some fairly solid growth as tender volumes increased by over 7%.

SONAR: Van Outbound Tender Volume Index (white, right axis) and Reefer Outbound Tender Volume Index (green, left axis)
By mode: After underperforming for much of January, the dry van market held up better than the reefer market this week even though tender volumes were lower. The Van Outbound Tender Reject Index fell by 2.5% week over week and is 2.81% lower than it was this time last year.
The reefer market experienced a significant drop in tender rejection rates over the past week, a blow to the positive momentum the market experienced dating back to early October. The Reefer Outbound Tender Volume Index fell by 12.8% over the past week and is nearly 7% lower y/y.
Tender rejection rates fall below 6% for first time since early November
Seasonal pressures are mounting as tender rejection rates have quickly retreated from the January highs. The winter weather disruptions in January were enough to keep tender rejection rates elevated throughout the month, but that meant declines in tender rejection rates were likely in February.

SONAR: Outbound Tender Reject Index — Seasonality View: 2025 (white), 2024 (green) and 2023 (pink)
Over the past week, the Outbound Tender Reject Index (OTRI) dropped by 136 basis points to 5.76%, one of the largest weekly declines, outside of the holidays, in the past year. The decline in tender rejection rates in February is seasonal, with the OTRI dropping during the first week of February in each of the past two years, but the size of the decline is the part to pay attention to. Even with the drop, the OTRI is 70 basis points higher than it was this time last year, the narrowest year-over-year gap since early October.

SONAR: Outbound Tender Reject Index – Weekly Change
The map above shows the Outbound Tender Reject Index — Weekly Change for the 135 markets across the country. Markets shaded in blue are those where tender rejection rates have increased over the past week, whereas those in red and white have seen rejection rates decline. The bolder the color, the more significant the change.
Of the 135 markets, just 21 reported higher rejection rates over the past week, down from the 76 that saw tender rejection rates rise in last week’s report.
Markets in Texas saw tender rejection rates increase over the past week, rising across the state. However, most of the increases were fairly small, especially in Dallas where rejection rates increased by 25 bps week over week. The largest markets in the country, Ontario, California, and Atlanta, saw tender rejection rates decline over the past week, falling by 52 bps and 75 bps, respectively.

SONAR: Van Outbound Tender Reject Index (white), Reefer Outbound Tender Reject Index (orange) and Flatbed Outbound Tender Reject Index (green)
By mode: Dry van tender rejection rates dropped below 6% this week for the first time since early December. The Van Outbound Tender Reject Index fell by 119 basis points w/w to 5.27%. Dry van tender rejection rates continue to hold on to y/y gains, albeit barely: They are just 31 bps higher y/y.
As with volumes, the positive momentum in the reefer market vanished this week as tender rejection rates suffered a fairly steep drop. The Reefer Outbound Tender Reject Index fell by 360 basis points to 12.97%. Even with the decline, the reefer market is still tighter than it was this time last year and reefer rejection rates are 563 bps higher y/y.
Flatbed tender rejection rates have given back nearly all of the increases felt during the final week of January. Over the past week, the Flatbed Outbound Tender Reject Index fell by 121 basis points to 10.01%. Compared to this time last year, flatbed tender rejection rates are down 352 bps, but if there is an uptick in activity in the industrial side of the economy, especially during the summer months, it will close the gap rather quickly.
Spot rates drop from January highs
With the seasonal decline in tender rejection rates, it also brought the seasonal pressures to spot rates. Spot rates have been on the decline since early in the month, which is fairly normal. The question now becomes, does the rate of decline stall out during February or does it continue and test year-ago levels?

SONAR: SONAR National Truckload Index (white, right axis) and Initially Reported Van Contract Rate (green, left axis)
The National Truckload Index (NTI) – which includes fuel surcharges and various accessorials – decreased by 6 cents per mile over the past week to $2.34. The NTI is 2 cents per mile higher than it was this time last year. The linehaul variant of the NTI (NTIL) – which excludes fuel surcharges and other accessorials – matched the NTI’s decline, falling by 6 cents per mile to $1.77. The NTIL is 6 cents per mile higher than it was this time last year, creating a gap with year-ago levels after dipping below them last week.
Initially reported dry van contract rates, which exclude fuel, were stable over the past week, remaining at $2.37 per mile, near the midpoint of the 52-week range. Compared to this time last year, the van contract rate is up 4 cents per mile, or 1.7%, which is roughly what is to be expected, especially as publicly traded carriers are starting to be more optimistic about a cycle turn.

SONAR: Spot (linehaul) to contract rate spread
The chart above, showing the spread between the NTIL and dry van contract rates, is trending back to pre-pandemic levels. Over the past week, the spread widened by 7 cents to minus 54 cents due to the rapid decline in spot rates. Compared to this time last year, the spread is 3 cents per mile wider than it was, though the overarching trend is for the spread to narrow.

The SONAR Trusted Rate Assessment Consortium (TRAC) spot rate from Los Angeles to Dallas gave back much of last week’s increase as spot rates have been largely trending lower since Christmas. The current spot rate along this lane fell by 10 cents per mile to $2.41, erasing all of last week’s decline. The spot rate is 15 cents per mile below the contract rate.

From Chicago to Atlanta, spot rates have been volatile since the beginning of the year. This week was no different. The spot rate along this lane increased by 7 cents per mile over the past week to $2.99 per mile. The spot rate remains above the contract rate, though now it is 17 cents per mile higher. The longer spot rates remain above contract rates, the more upward pressure there will be on contract rates.