Infographic: Freight Commodity Statistics

Infographic: Freight Commodity Statistics

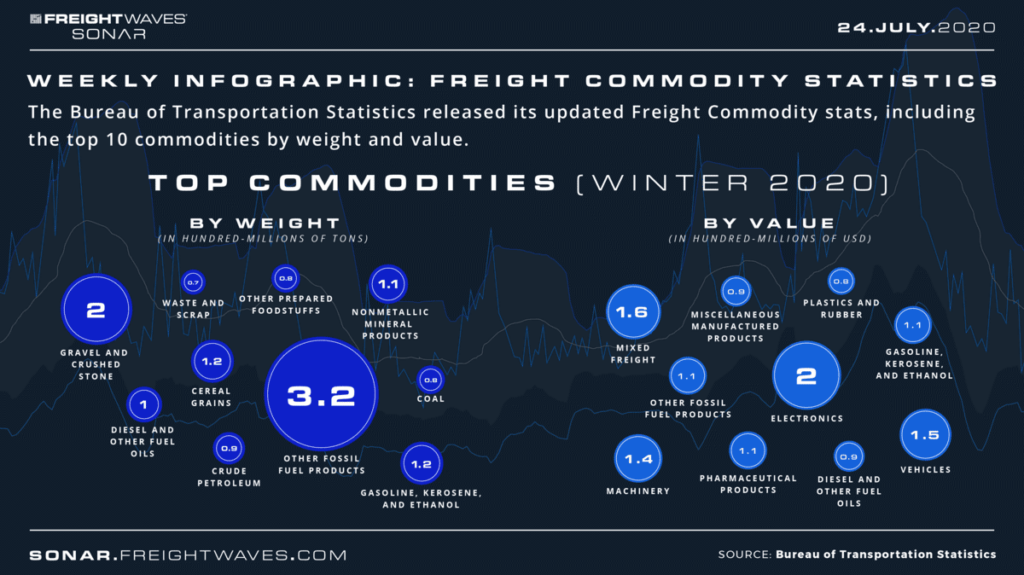
Bureau of Transportation Statistics data shows other fossil fuel products, including coal and petroleum products, were the top commodity by weight at 3.2 billion tons. More than 75% of this commodity is being moved by pipeline. Electronics were the top commodity by value at $2 trillion. Truck was the preferred method of shipment for electronics, holding more than a 60% share of these shipments. Not surprisingly, truck dominates the low- to mid-length of haul routes while rail is the preferred mode for 1,000 to 2,000 miles.

Related Posts

Why so many freight brokers are struggling to stay afloat

SONAR and OTR Solutions Partner to Bring Data-Driven Rate Intelligence Directly to Carriers

SONAR Releases new Truckload Data and Air and Ocean Dashboard

Search

Search

What's the SONAR ROI?

Artboard 4
Carrier
Artboard 5
Shipper
Artboard 6
Broker

Read Recent Posts

January 6, 2026

Why so many freight brokers are struggling to stay afloat

December 17, 2025

SONAR and OTR Solutions Partner to Bring Data-Driven Rate Intelligence Directly to Carriers

December 2, 2025

SONAR Releases new Truckload Data and Air and Ocean Dashboard

White Papers
December 22, 2025

December 2025 The State of Freight: A Look Back at 2025

December 17, 2025

Case Study: Household Products Shipper Improves OTIF and Cuts Costs During National Retail Promotion

December 3, 2025

November 2025 The State of Freight White Paper