How Can Freight Forecasting Aid Consolidation Strategies?
Supply chains across the U.S. are experiencing the stresses of trying to fill orders and comply with mandates affecting travel, driver hours and person-to-person contact. Despite the state of the economy, trucking volumes are still up 25% year-over-year in July 2020.
Meanwhile, the sudden surge in demand for e-commerce has contributed to total industry advancements that would normally take six years to complete to occur within six months, reports John Koetsier of Forbes. In turn, companies are asking more questions about how to meet rising demand, including, “what is freight consolidation?” Rather than getting bogged down in a list of possible questions, let’s isolate freight consolidation in this post.
What Is Freight Consolidation?
Freight consolidation is the practice of building smaller shipments up into larger sized pallets to take advantage of bigger, longer freight hauls. In other words, parcels build into less-than-truckload (LTL) shipments. LTL shipments build into truckload (TL) shipments. While this affords a chance to avoid an all-parcel shipping strategy that incurs higher costs, it does take some care to ensure those extra efforts to consolidate and deconsolidate freight do not lead to higher freight spend as well. That’s where freight forecasting and predictive data insights come into play.
Freight forecasting is key to creating the right mix of carriers, modes, and more to leverage freight consolidation
Freight forecasting is necessary in freight consolidation because it relies on an assumed cost of breaking down freight into smaller shipments at a later date. Depending on the total lead time and trends in the industry, consolidation may very well be more expensive than shipping by parcel alone. But if companies successfully consider the total costs of consolidation while reviewing influences that may contribute to changing rates, they can still achieve savings. Remember that freight consolidation is associated with a significant reduction in the total freight spend. As further explained by Kyle Hugo via Inbound Logistics:
“With the advantage of truckload pricing at an LTL size, consolidation provides significant opportunities for cost savings. With the objective of maximizing the trailer utilization, freight from multiple vendors or different parts of a supply chain can be staged at a central location to be sorted, combined, and loaded into full truckloads. The gained advantage of the faster transits from the consolidation point means some shippers can convert their leg-one move to a more affordable shipping method, such as intermodal, providing even greater savings.”
When it comes time to answer, “what is freight consolidation?” it is a predictive measure of savings that is possible when using bigger, longer haul carriers at discounted rates.
Additional steps in applying forecasting data to consolidate and deconsolidate freight
Speaking of the questions surrounding the topic of “what is freight consolidation,” shippers and carriers need to think about the other steps involved in applying forecasting data to efficiently consolidate and deconsolidate freight, including:
- Consider outside influences. Outside influences, ranging from politics to weather, can affect the total costs charged by linehaul carriers. Even origin-destination lanes may have vastly different influences affecting rates, and by using forecasting data, shippers can see which lanes are going to result in savings through consolidation versus those that need to remain in parcels.
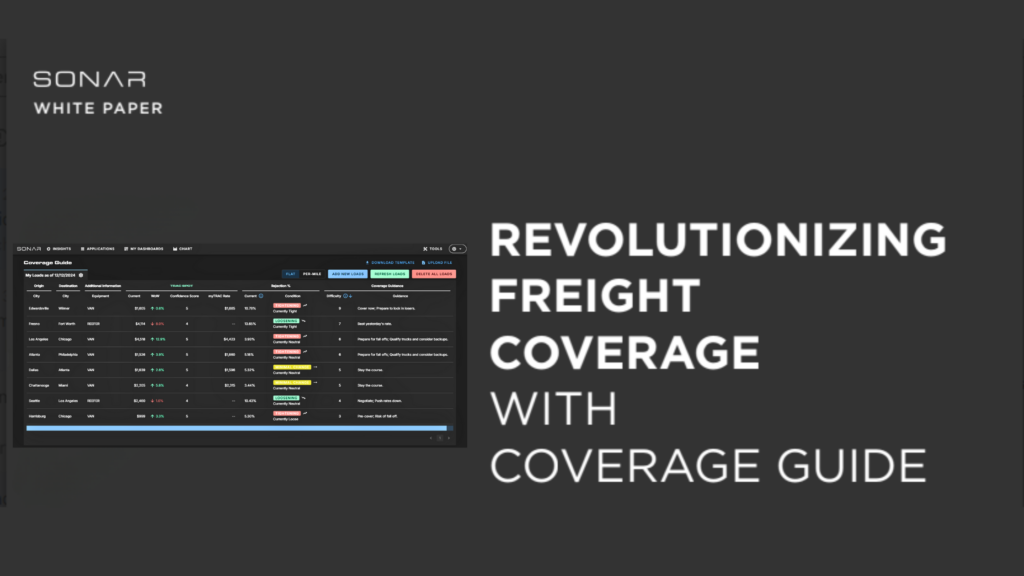
- Review available freight rates. Every shipper knows that reviewing freight rates is a key to savings. However, not all shippers look to review whether contracted and spot rates are better for each shipment. If that is too much work, imagine the missed opportunities when transforming what might have been a simple shipment into a three-pronged multi-modal shipment that must go through a series of consolidation and deconsolidation steps at different legs. It’s complex, so having a simple way to review data, such as a dashboard that shows trends by mode, type, leg, lane, and more, is key to reducing stress.
- Think about opportunities for backhauls. Getting freight consolidated and shipped sounds great, and it also includes an opportunity to leverage backhauls for carriers. Now, the carriers can apply similar freight forecasting data to review whether they are charging a competitive rate for moving LTL or full truckload, and if not, they may be able to renegotiate contracts or even reject tenders outright. It’s an ongoing process that requires informed decision-making.
Remember that data alone cannot keep spend under control, but it provides the roadmap to savings in consolidation
Answering, “what is freight consolidation?” can be among the complex aspects of supply chain management. It includes dozens of opportunities for error that will inevitably contribute to higher freight spend when those errors arise. However, informed shippers that consider these risks and how consolidation efforts can pay off for freight spend reductions are more likely to see the fruits of their labor. Also, remember that freight data alone lacks value, but when applied, it can generate big savings. Find out how to get started and see the freight forecasting data needed to maximize consolidation profitability by requesting a SONAR demo online today.


