Spot rate and tender rejection rates trend higher.
This week’s SONAR Pricing Power Index (PPI): 45 – The freight market is approaching equilibrium. That rating remains unchanged from the prior report and could rise in upcoming reports as the freight market potentially becomes tighter with further reductions of capacity, including seasonal capacity reductions as the holidays approach.
Three-month SONAR Pricing Power Index (PPI) Outlook: 60 – The market may shift to being in carriers’ favor as capacity continues to leave the market. That rating is also unchanged from the previous report. The potential for continued weakness in freight volume remains the main risk to that outlook.
In last week’s PPI report, I described why the three-month outlook increased from 55 to 60, reflecting a greater probability that the market may flip to being at least somewhat of a carriers’ market in the next few months. Recent spikes in spot rates, increases in tender rejection rates, and carriers’ comments regarding this year’s fall peak all added conviction to that outlook. SONAR data in the past week shows a continuation of those recent trends.
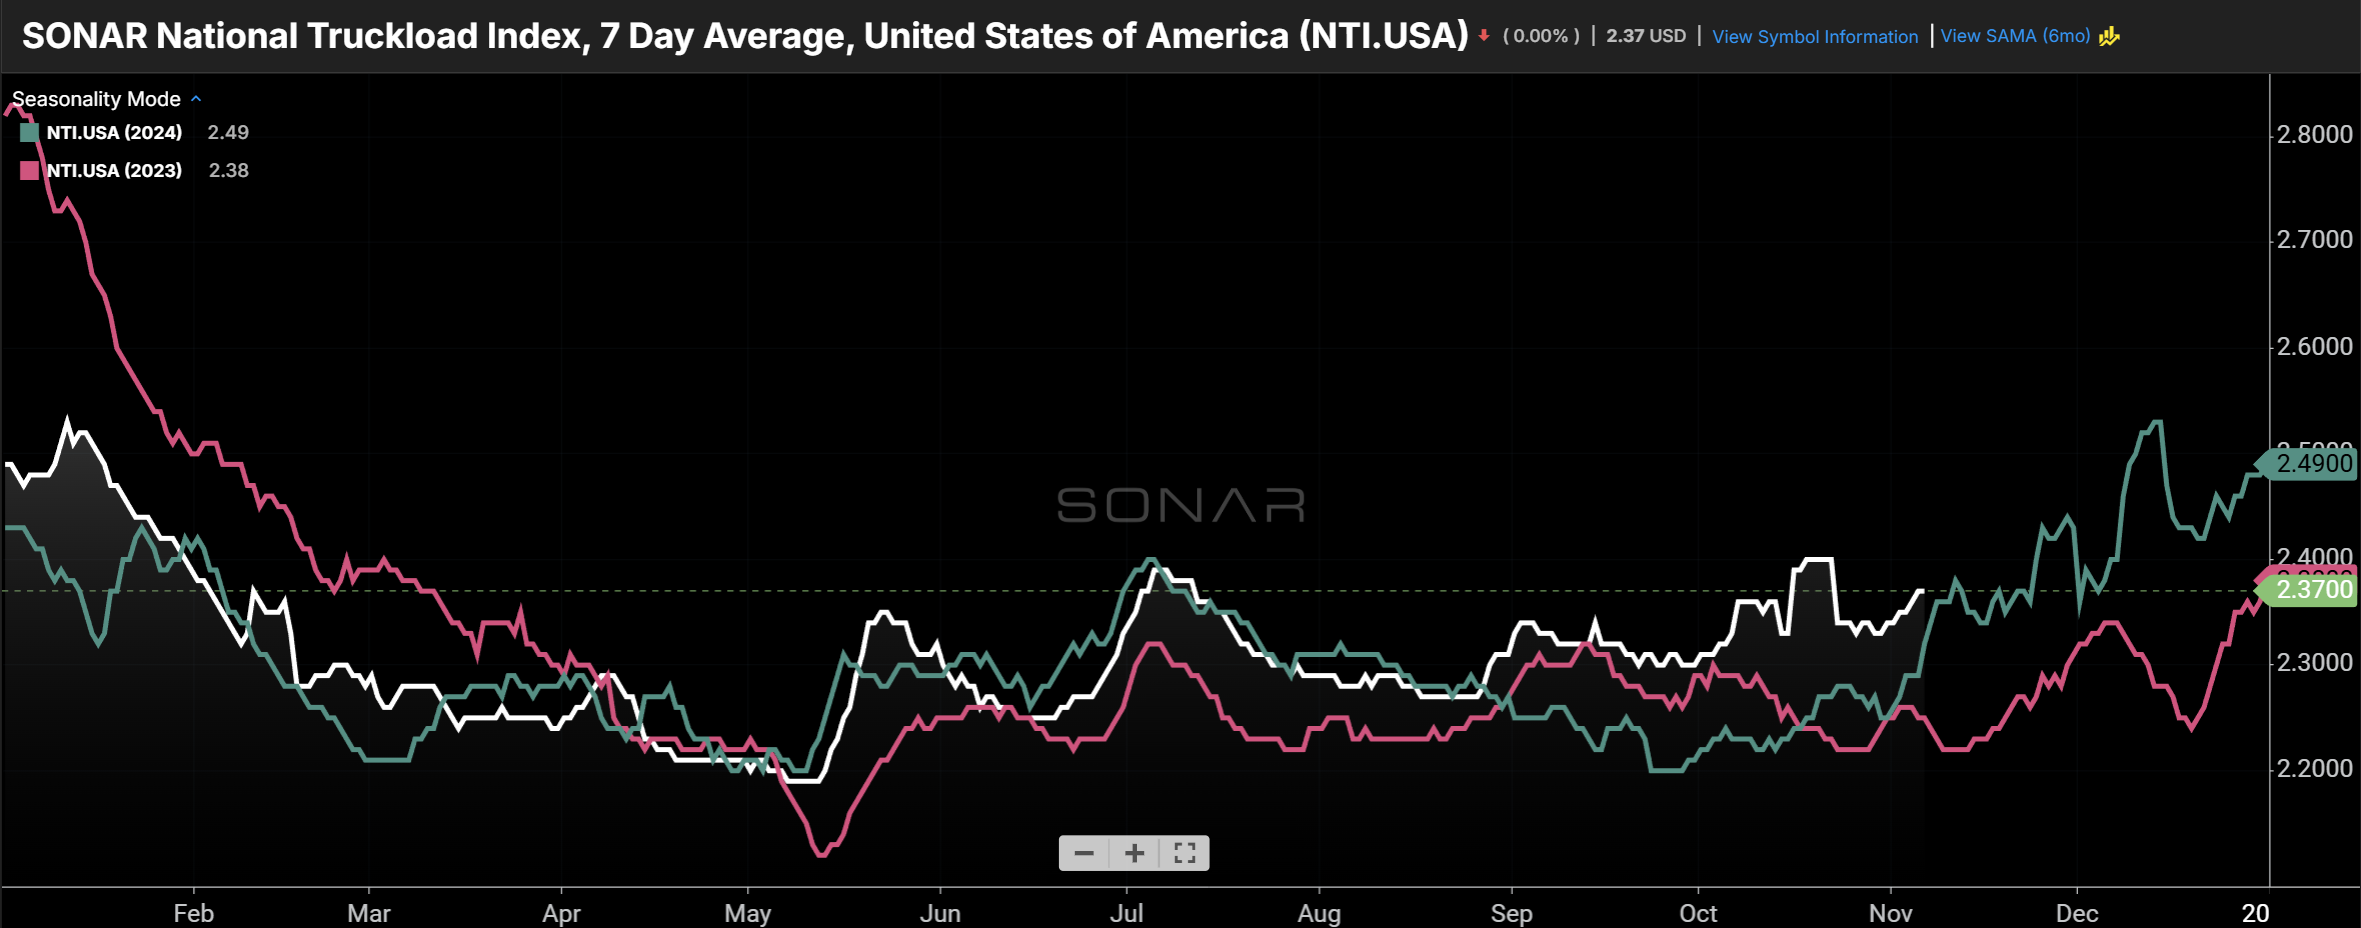
Average spot rates, displayed in the SONAR National Truckload Index (NTI.USA), increased in the first week of November and remain above year-ago levels against an increasingly difficult year-ago comparison. Going forward, the question is whether further reductions in capacity, combined with seasonal improvement in freight demand, will push spot rates to levels not seen in recent years. (Chart: SONAR)
Spot rates shot up at the beginning of October, driven by a step-up in the enforcement of immigration and cross-border issues (English language proficiency, non-domiciled drivers, cabotage). At the start of November, the increase in spot rates appears more driven by typical seasonality, as retailers move inventory to points of consumption. As of November 6th, the average spot rate is $2.37/mile, up $0.04 week over week and $0.05 higher than this time last year.

Freight demand has been disappointing all year, inhibiting the freight market from tightening. A comprehensive measure of freight demand, the Outbound Tender Volume Index is shown for 2023, 2024, and 2025 in pink, green, and white, respectively. (Chart: SONAR)
Freight demand continues to disappoint based on tender volume data (down 15% year over year), although it did post a mini-pickup since mid-October, which is expected seasonally, up 176 basis points in the past two weeks. That increase was driven by short-haul freight movements to support the retail channel. The combination of rising spot rates and falling freight volume is especially problematic for brokers.

The chart above shows the year-over-year change in tender volume broken down by length of haul. Tender volume for loads of less than 100 miles (red line) has held up better this year than longer lengths of haul, reflecting a resilient retail sector. Short-haul tender volume was also responsible for the mini-pickup in tender volume over the past two weeks. Long-haul tenders have been the worst-performing segment – that trend should continue given that retailers expect muted import volume. (Chart: SONAR)

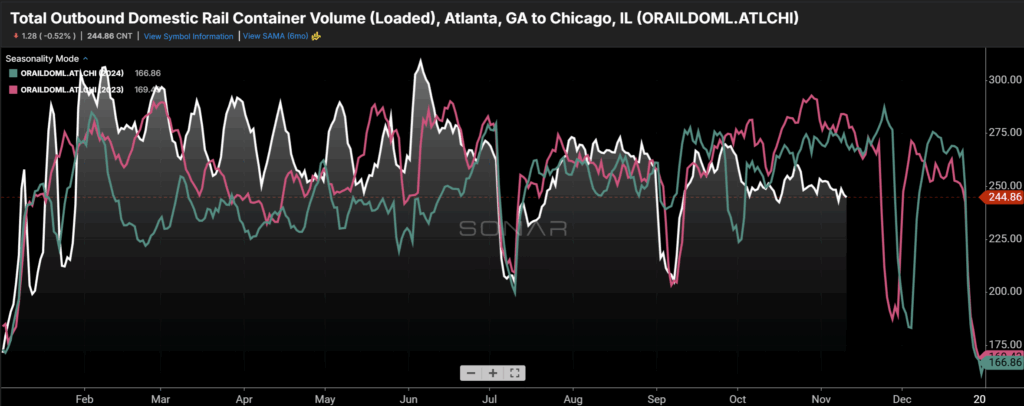
Containerized domestic intermodal (i.e., loaded 53’ containers) volumes have held up much better than truckload tenders and are trending roughly in line with strong year-ago levels. Despite falling import volume, domestic intermodal carriers are experiencing a meaningful end-of-year peak as inventory near ports is moved to consumption centers. (Chart: SONAR)

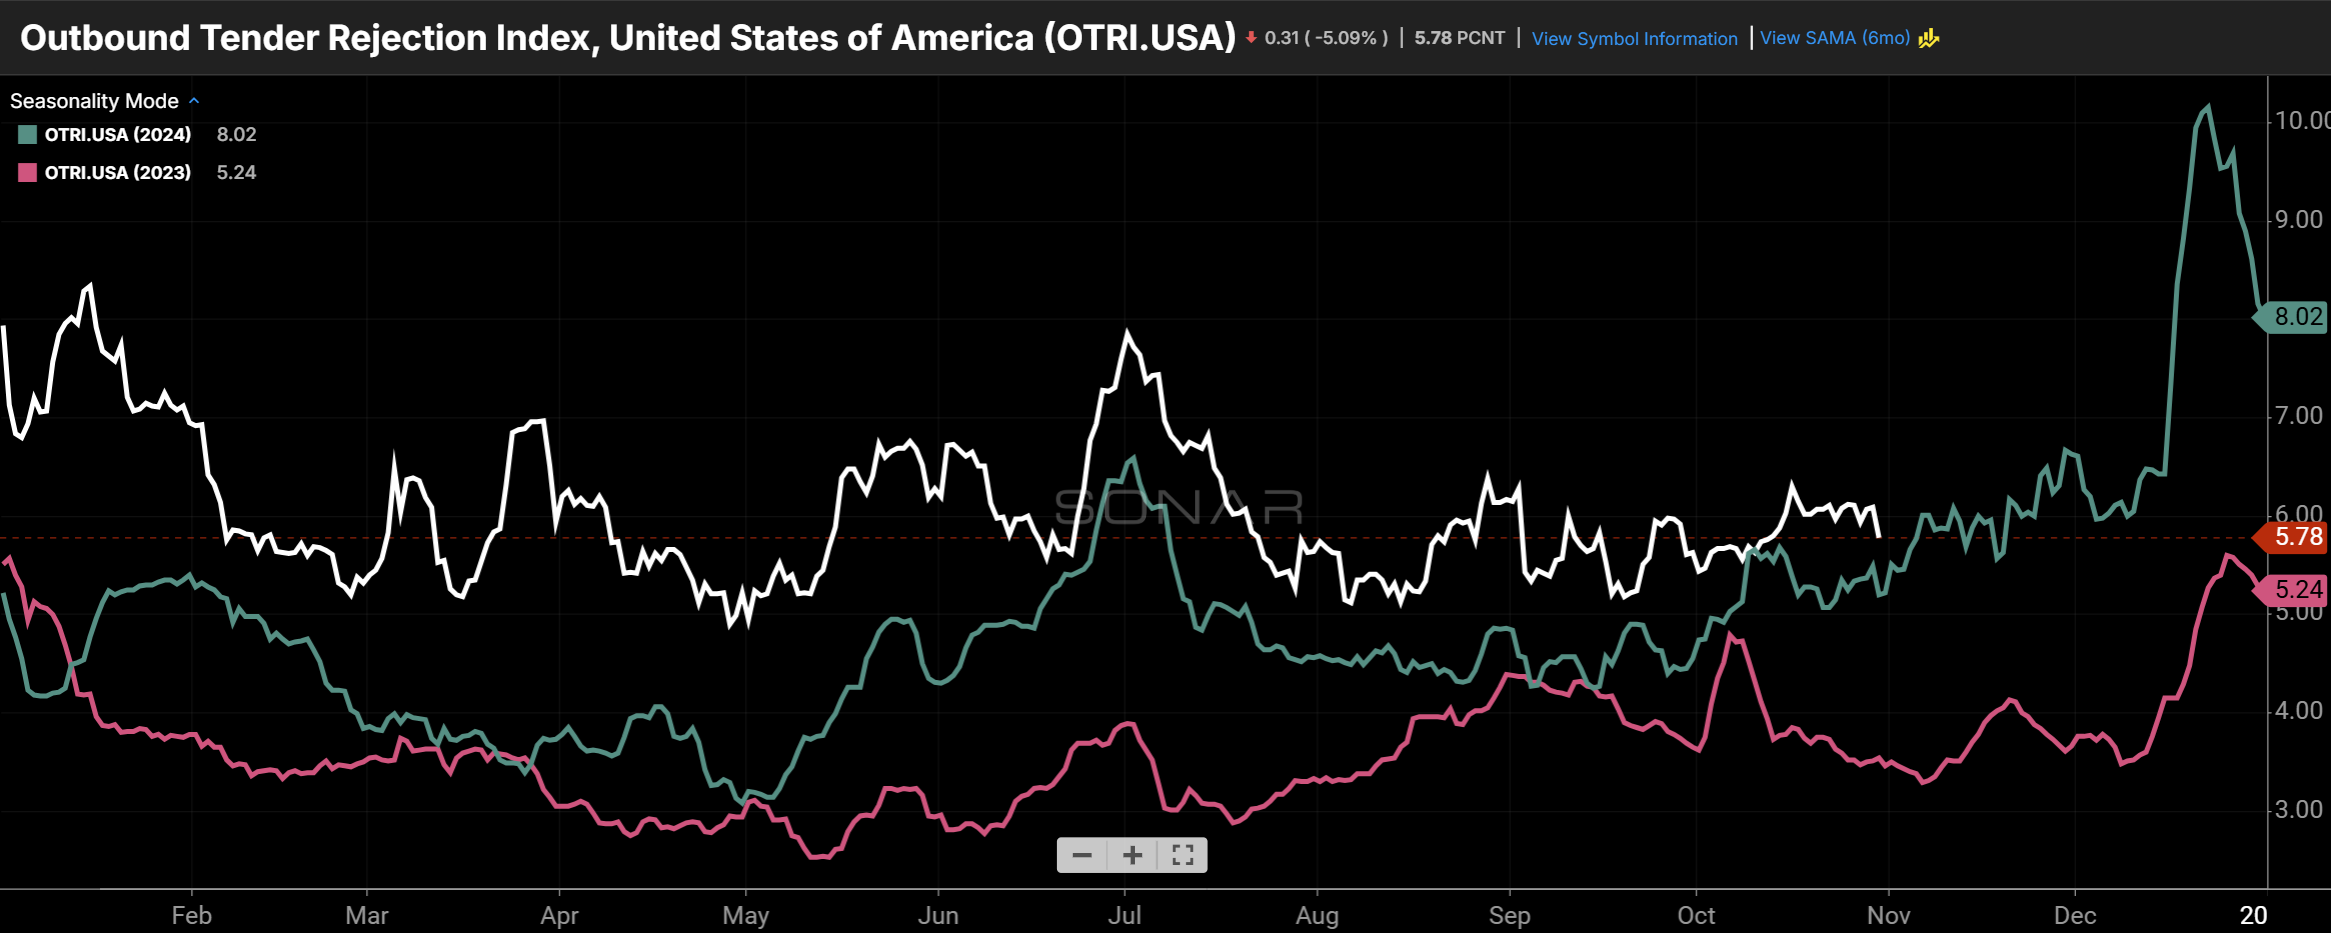
The nationwide tender rejection rate currently stands at 6.36% and is on an upward trend as capacity is removed from the industry and the holidays approach. (Chart: SONAR)
Tender rejection rates reflect the intersection of supply and demand. Industry participants are watching to see whether the metric indicates a tightening in the freight market. The current overall tender rejection rate of 6.36% breaks down to 5.87%, 16.43% and 11.48% for the dry van, reefer, and flatbed segments, respectively. Rejection rates have consistently remained above year-ago levels despite tender volume (demand) remaining sharply below year-ago levels, which suggests a massive exit of capacity. As a basis for year-end expectations, at the end of last year, the tender rejection rate reached 10% in December before trending in the 7%-9% range in January.
About the SONAR PPI: The SONAR Pricing Power Index is a qualitative assessment of the balance of negotiating power between shippers and carriers on a scale of 0 to 100 using SONAR data and anecdotes from discussions with SONAR clients. The higher the number, the tighter the freight market and the more that pricing power favors carriers. A 50 represents a balanced market. While the SONAR PPI primarily pertains to the truckload sector, given its size, dynamics in other sectors, such as intermodal and ocean, are also considered.