Weak truckload demand for mid- and longer-hauls hold back freight market
This week’s SONAR Pricing Power Index (PPI): 45 – The freight market is approaching equilibrium. That rating remains unchanged from the prior report despite a slight drop in spot rates in the past week. Changes in the rating going forward will be based on how market data responds to the holiday season, when the freight market often tightens.
Three-month SONAR Pricing Power Index (PPI) Outlook: 60 – The market may shift to being in carriers’ favor as capacity continues to leave the market. That rating is also unchanged from the previous report. Periods of temporary tightness around the holidays would be an indicator that it could be a carriers’ market on a more sustained basis in the coming months. The potential for further weakness in freight volume remains the main risk to that outlook.
In YTD first, the average spot rate is below year-ago levels.
In the past week, the average spot rate took a step down. It declined $0.04 week over week and is below year-ago levels for the first time since late August. But a relatively minor change over just one week does not make a trend, and the next two weeks will be telling. Capacity comes out of the market around Thanksgiving as some drivers take time off, and freight demand can be driven by last-minute store stocking and replenishment. The impact should be visible in nationwide data sets for both spot rates and contract rates – the question is how visible. The next two weeks should provide insight into what the freight market might look like next year with further carrier exits and/or stabilization/improvement in freight demand.

Contrary to normal seasonality, average spot rates, displayed in the SONAR National Truckload Index (NTI.USA), took a step down in the second week of November. (Chart: SONAR)
Spot rates shot up at the beginning of October, driven by a step-up in the enforcement of immigration and cross-border issues (English language proficiency, non-domiciled drivers, cabotage). Now, the average spot rate is $0.07 off its high and just $0.02 above where it started in October. As of November 16th, the average spot rate is a penny below this time last year. The implication is that there was widespread fear of enforcement/over-enforcement, of labor laws at the beginning of October, and some of that fear has dissipated, leading some drivers to return to the market.
Diesel prices have been volatile, so it also makes sense to look at the average spot rate on a fuel-neutral basis, which is availble via the NTIL.USA, as shown below.

The average spot rates are further below year-ago levels when the impact of fuel is backed out. (Chart: SONAR)
When considering the spot market, the health of brokers/3PLs should be considered. Evidence is mounting that we are entering the worst possible market for brokers. That is, low overall freight volume, few available spot loads (which brokers rely on), and rising spot rates (proxy for brokers’ buy rates) that are not yet reflected in contract rates (proxy for brokers’ sell rates). In other words, low volume and thin margins for brokers.
Some brokers are likely to go out of business in that market, including some major ones. In those same market dynamics, small carriers stand to benefit from rising rates, but may struggle to find loads, especially if brokers the brokers they were relying on for volume fail. Meanwhile, the major brokers are reducing their roster of carriers to those they can verify to mitigate fraud risk. The combined result may be a hastening of small carrier capacity leaving the market.
Volume is solid in only two segments – short-haul TL and domestic rail intermodal

Freight demand continues to disappoint, including a step-down in demand in the past week. A comprehensive measure of freight demand, the Outbound Tender Volume Index is shown for 2023, 2024, and 2025 in pink, green, and white, respectively. (Chart: SONAR)
Freight demand continues to disappoint based on tender volume data (down 14% year over year). The difference in freight demand between shorter-haul and longer-haul demand continues to widen. The 10% increase in City haul y/y (less than 100 miles) suggests that short-haul freight is moving to support the retail channel, including a resiliant e-commerce sales.

City tender volume (<100 miles, red line) is up nicely year over year, while long haul volume (>800 miles, white line) is down shaply year over year. (Chart: SONAR)
In the past week, I’ve heard that “intermodal volume is declining.” But that has really been limited to the international segment while the domestic intermodal segment, which more directly competes with long-haul truckload, has held up much better, as shown below.

Containerized domestic intermodal (i.e., loaded 53’ containers) volumes have held up much better than truckload tenders and are trending nearly in line with strong year-ago levels. Domestic intermodal carriers are experiencing a meaningful end-of-year peak as inventory near ports is moved to consumption centers. (Chart: SONAR)
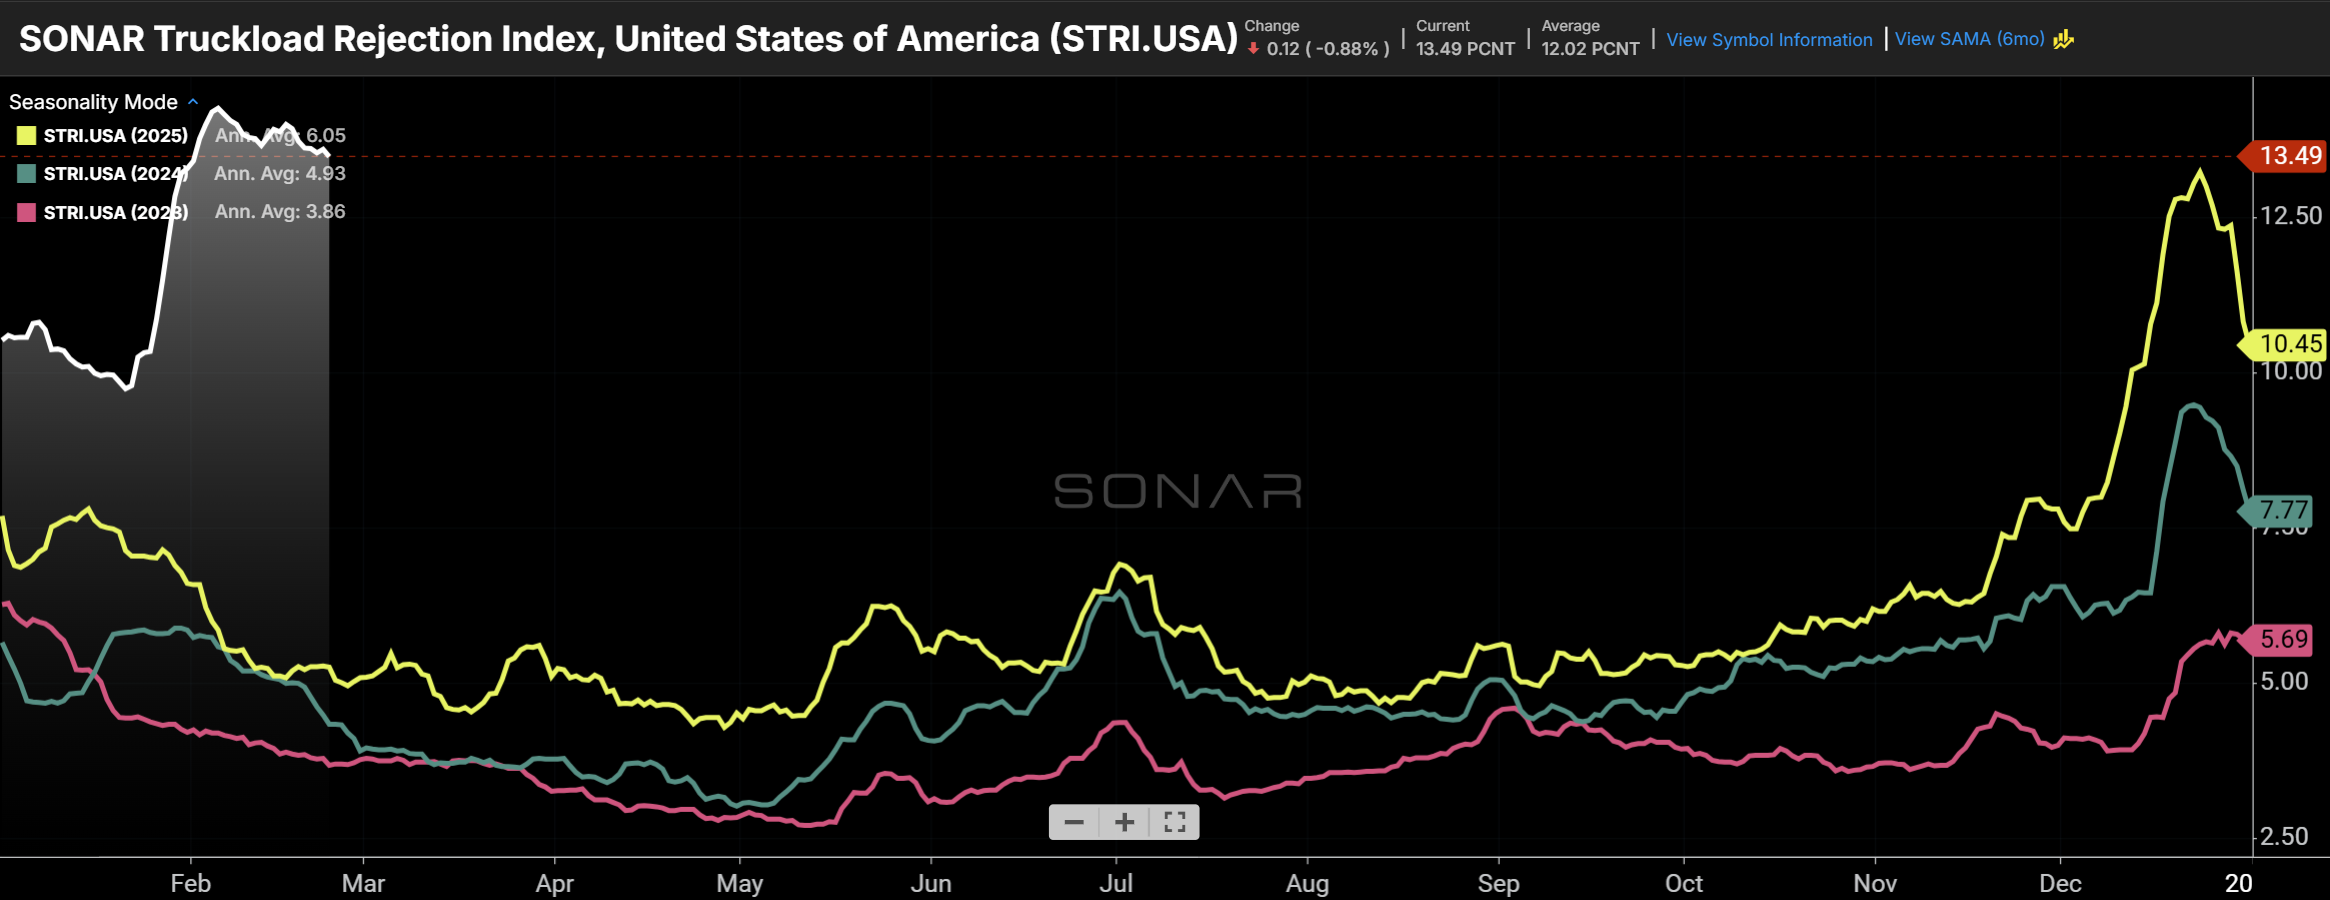
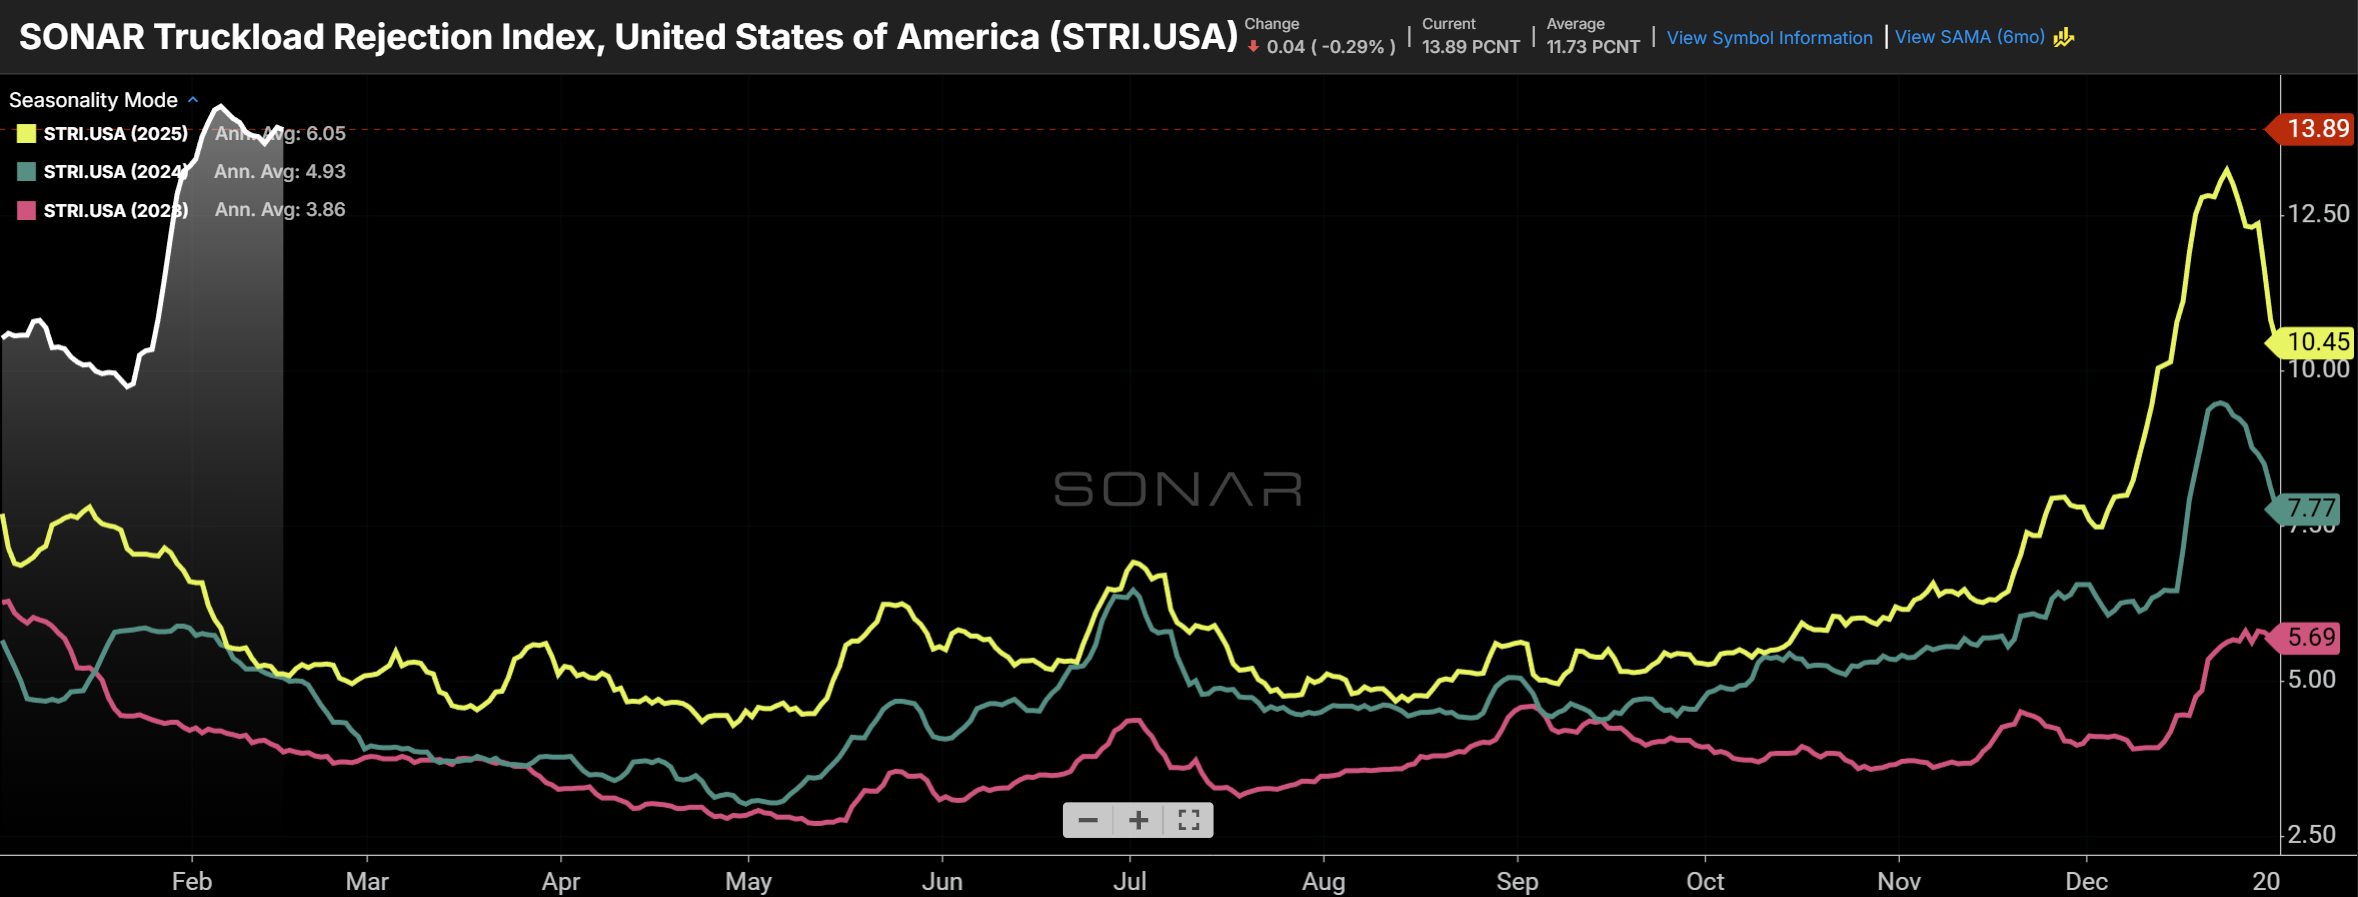
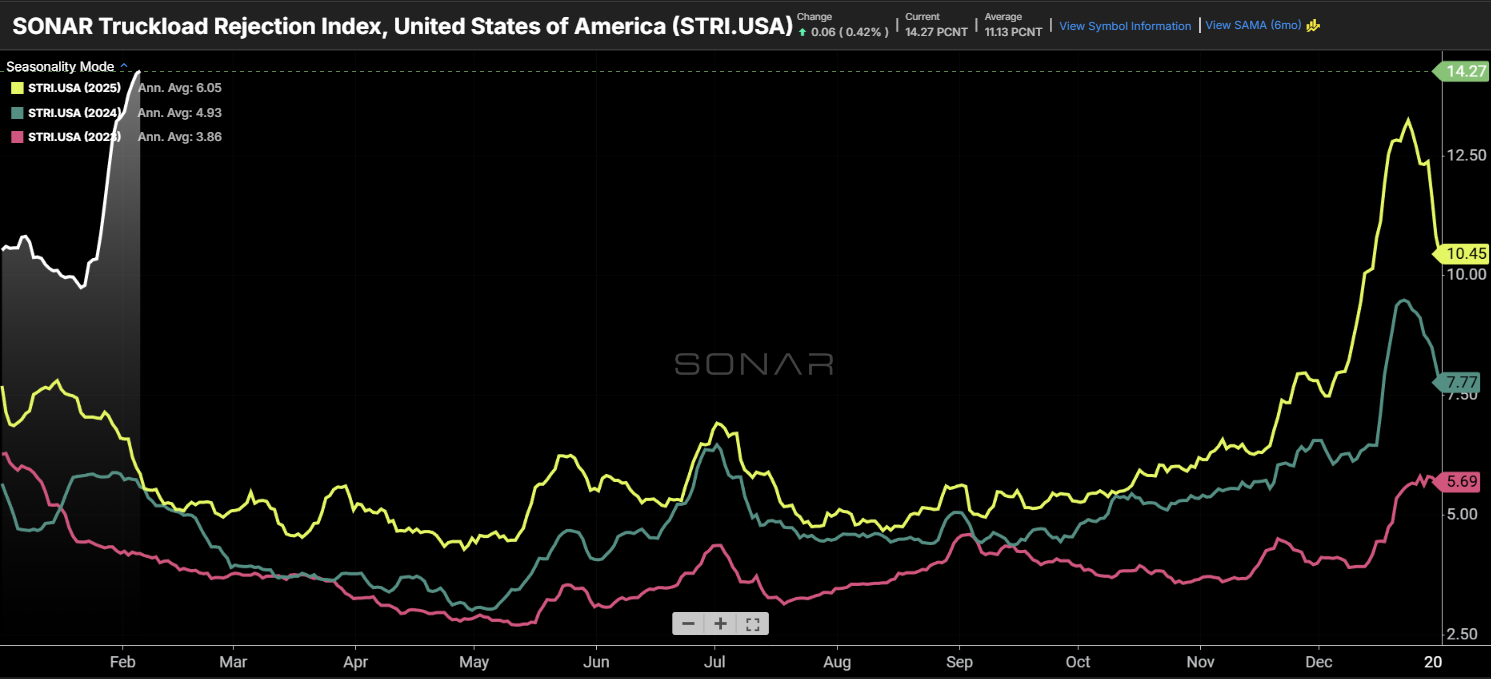
Tender rejections now roughly in line with last year – is a seasonal surge forthcoming?

The nationwide tender rejection rate currently stands at 5.83%, right in line with last year after being above year-ago levels all year. (Chart: SONAR)
Tender rejection rates reflect the balance of supply and demand in the market, and a tender rejection rate close to 6% suggests that the market, overall, is close to balanced. Currently, the overall tender rejection rate of 5.83% is essentially in line with this time last year after being above year-ago levels all year. It remains to be seen whether the market will see a spike in late November and December, like the past two years and, if so, of what magnitude. What’s remarkable about flat tender rejections year over year is that the sharp decline in tender volume (demand) compared to last year implies that a massive amount of capacity has left the market.
That 5.83% overall tender rejection rate breaks down to 5.53%, 13.42%, and 12.39% for the dry van, reefer, and flatbed segments, respectively. So, participants in the reefer and flatbed sectors are experiecing a market that is much more favorable to carriers than those playing in the larger dry van sector.
About the SONAR PPI: The SONAR Pricing Power Index is a qualitative assessment of the balance of negotiating power between shippers and carriers on a scale of 0 to 100 using SONAR data and anecdotes from discussions with SONAR clients. The higher the number, the tighter the freight market and the more that pricing power favors carriers. A 50 represents a balanced market. While the SONAR PPI primarily pertains to the truckload sector, given its size, dynamics in other sectors, such as intermodal and ocean, are also considered.