In weather vs. market debate, most data suggest market is shifting in carriers’ favor
This week’s SONAR Pricing Power Index (PPI): 60 (unchanged) – Since spot rate and tender rejection rates spiked in late January, the debate has been whether it has been primarily, or entirely, driven by winter storms or whether enough capacity has left the market that a carriers’ market is finally upon us. While tender volume, which was elevated around the storms, has normalized, tender rejection rates and spot rates have only come down from their highs only slightly, giving credence to the view that the freight market recession is finally over. Tender rejection rates and spot rates are likely to decline further in the coming weeks, but look for them to stay above year-ago levels, which should ultimately lead to rising contract rates.
Three-month SONAR Pricing Power Index (PPI) Outlook: 60 (Unchanged) – Primarily due to factors limiting freight capacity, the freight market outlook should remain in carriers’ favor in three months, even in the absence of temporary disruptive events. Three months from now, the market should be strong seasonally as summer merchandise is moved ahead of Memorial Day. Nevertheless, given recent macroeconomic trends, the primary risk to that outlook is the potential for poor freight demand.
Tender rejection rates remain high
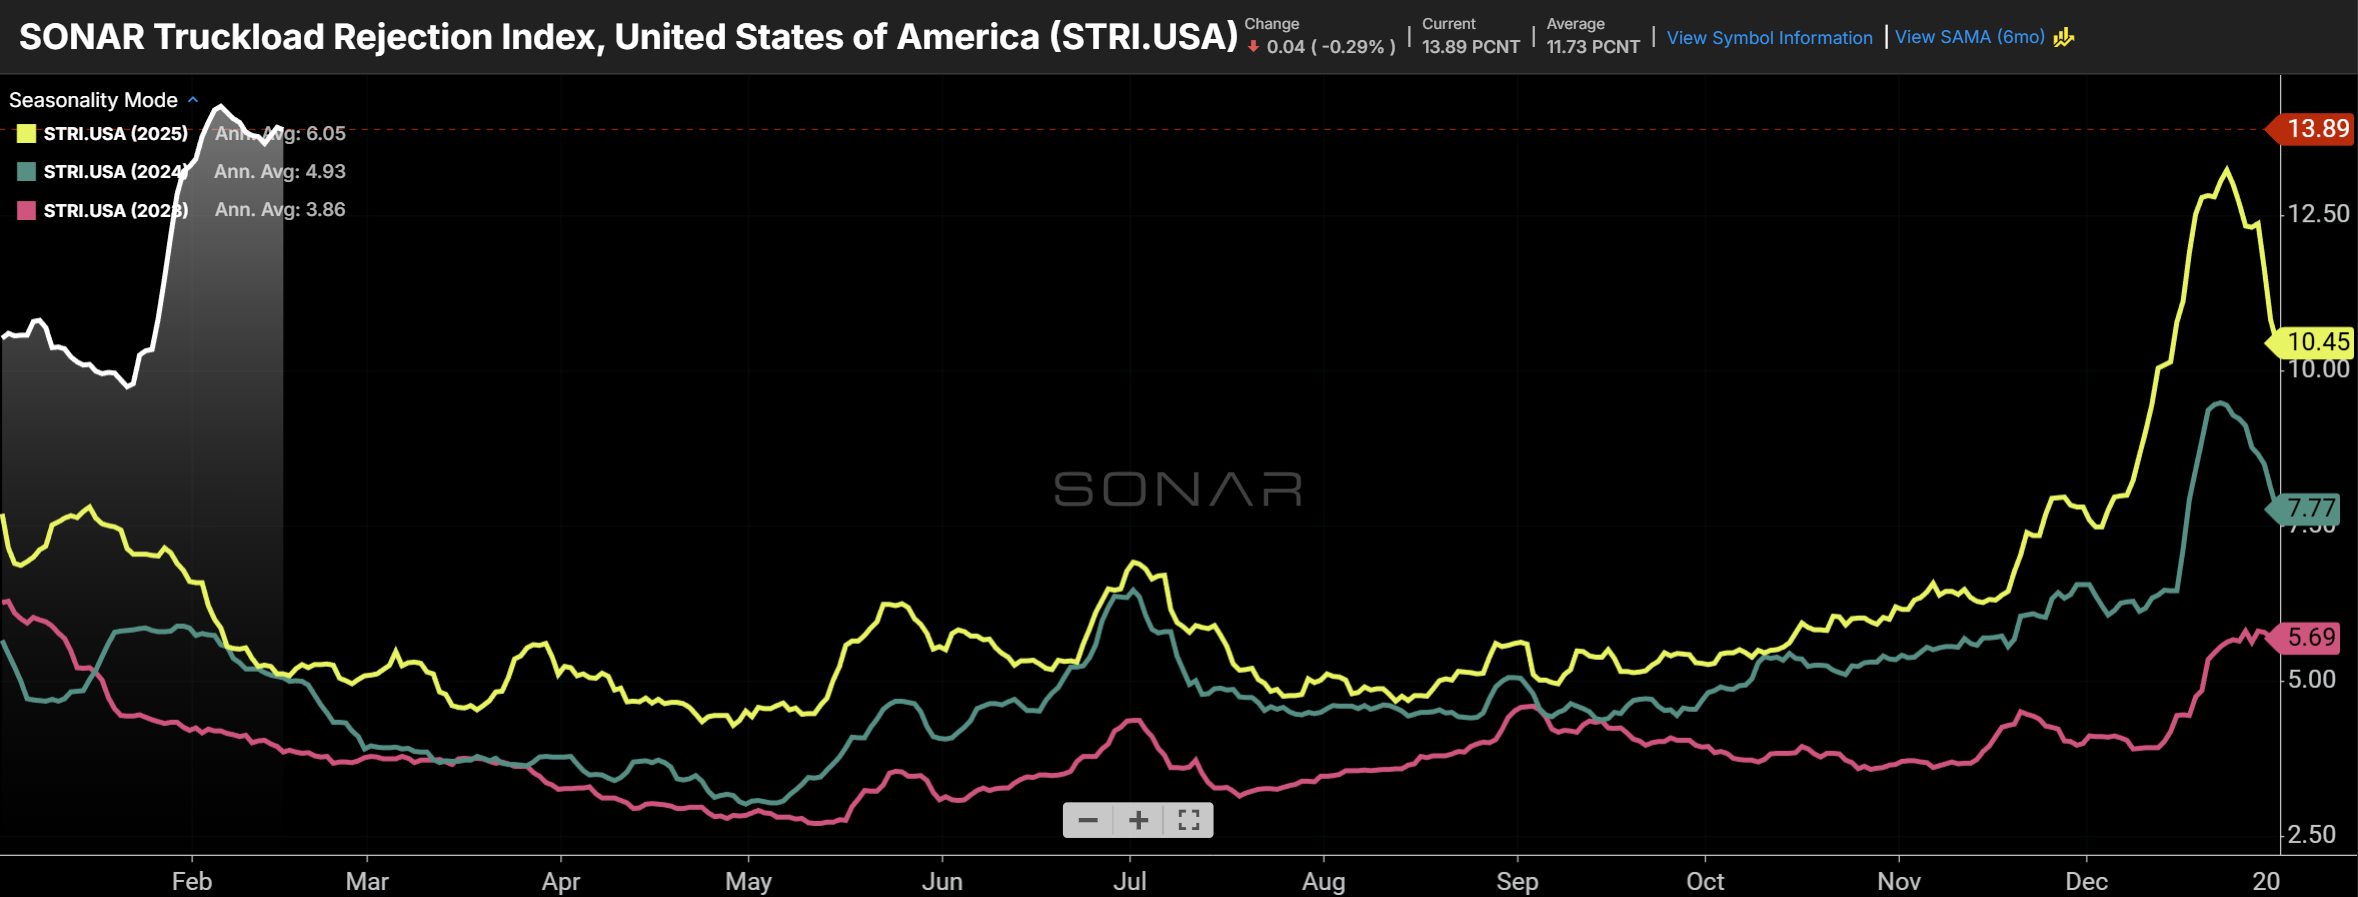
The national tender rejection rate (2026 – white line) is off its high, but continues to show freight market tightness. (Chart: SONAR)
The national tender rejection rate is off its high, but not by much. Currently 13.9%, which represents the behavior of carriers in response to tenders in the past week, the national tender rejection rate is down only slightly from a high of 14.3% a week and a half ago (and up from just 9.8% before Winter Storm Fern’s impact). For comparison, following the February 2021 Texas Freeze, under the backdrop of an already-tight freight market, the national tender rejection rate increased from 20% to 27%. As the tender rejection rate stays elevated, the debate over separating the impact of weather from other market-driven factors is shifting toward the marketplace having the greater impact.

Tender rejection rates have remained elevated across equipment types, with the highest rejection rates in the smaller and more specialized reefer and flatbed segments. Since the last PPI report, only the dry van segment declined, from 13.2% to 12.6%. The SONAR Truckload Rejection Index is shown above for dry van (white), reefer (green), and flatbed (red) segments. (Chart: SONAR)
Spot rates plateau at a high level

The average spot rate, displayed in the SONAR National Truckload Index (NTI.USA), surged following Winter Storm Fern, and has been slow to come back down. (Chart: SONAR)
The national average spot rate only came down $0.03 in the past week and a half from $2.82/mile to $2.79/mile. Before Winter Storm Fern, the average spot rate was around $2.55/mile. The peak last Christmas was $2.76/mile, and one year ago the average rate was $2.32/mile. Like tender rejection rates, spot rates may come down significantly in the coming weeks, but the past few weeks have demonstrated that carriers have pricing power that they didn’t have in the past few years, outside of short-lived periods surrounding disruptive events like holidays or International Roadcheck.

Rising spot rates have led to a collapse in the spread between contract and spot rates. That leads to pressure on brokers’ margins, and ultimately, should lead to contract rates that rise as contracts are rebid. (Chart: SONAR)
Demand has normalized following the winter storms

Truckload tender volume surged in the days surrounding Winter Storm Fern, but has since retreated to year-ago levels. (Chart: SONAR)
As described above, tender rejection rates and spot rates suggest that the freight market’s recent tightening has been largely driven by capacity leaving the market with winter storms just providing a spark. That spark came in the form of capacity temporarily being taken offline combined with a one-time surge ahead of, and/or following, facility closures. In addition, it appeared that some freight was moved via truckload in the days surrounding the storm that would have otherwise been moved via rail intermodal.
Total tender volumes are now right in line with where they were in late January and also roughly in line with year-ago levels. It’s not clear where demand will settle in the coming weeks, considering that February is typically seasonally weak for freight demand. Prior to the dates impacted by the storm, tender volume had been trending down about 4% year over year, and down about 6% on a two-year stack.
Forward-looking demand metrics are mixed. The Class I railroads have called out the numerous headwinds they see in the industrial economy, particularly in housing and automotive, leading to cautious volume outlooks. The consumer economy is showing mixed messages, with pessimistic sentiment surveys, affordability concerns, and slowing hiring that are at odds with resilient consumer spending.

Domestic rail intermodal volume dipped during the storm, which may have sent some time-sensitive loads to truckload, but rail networks recovered quickly, leading to a return in volume. (Chart: SONAR)
About the SONAR PPI: The SONAR Pricing Power Index is a qualitative assessment of the balance of negotiating power between shippers and carriers on a scale of 0 to 100 using SONAR data and anecdotes from discussions with SONAR clients. The higher the number, the tighter the freight market and the more that pricing power favors carriers. A 50 represents a balanced market. While the SONAR PPI primarily pertains to the truckload sector, given its size, dynamics in other sectors, such as intermodal and ocean, are also considered.