Disruption was most impactful in Memphis, Dallas, and Houston
This week’s SONAR Pricing Power Index (PPI): 55 (Unchanged) – Winter Storm Fern was arguably the most disruptive winter storm to the freight market in nearly five years, and the adverse weather events continue in key freight regions. The data suggests that the impact placed the market in the shippers’ favor – accordingly, the PPI is greater than 50 following the report’s upgrade.
While the winter weather impact is temporary and declines in tender rejection rates and spot rates should be expected in the coming weeks, the degree to which market data responded to weather supports the view that the freight market may be in, or close to, shippers’ favor even when the impact of winter weather subsides.
Three-month SONAR Pricing Power Index (PPI) Outlook: 60 (Unchanged) – Largely due to factors limiting freight capacity, the freight market may shift to being in carriers’ favor, on a more consistent basis, in three months. The primary risk to that outlook is that a demand catalyst may not materialize, which historically is needed for a true carriers’ market to emerge.
Rejection rates and spot rates soar
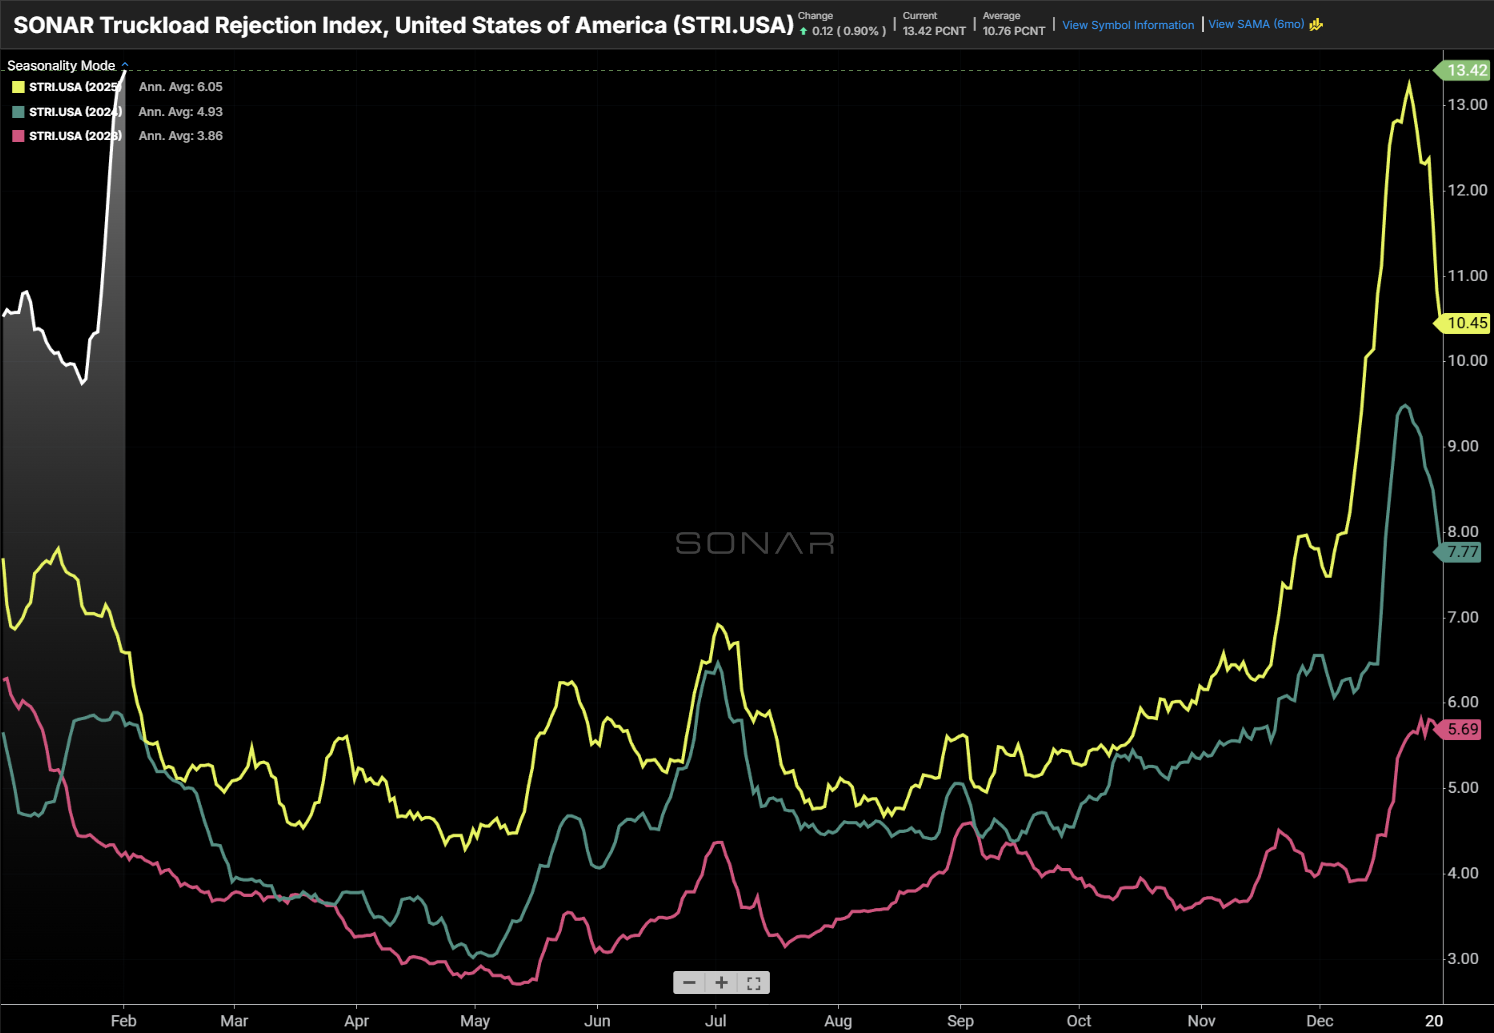
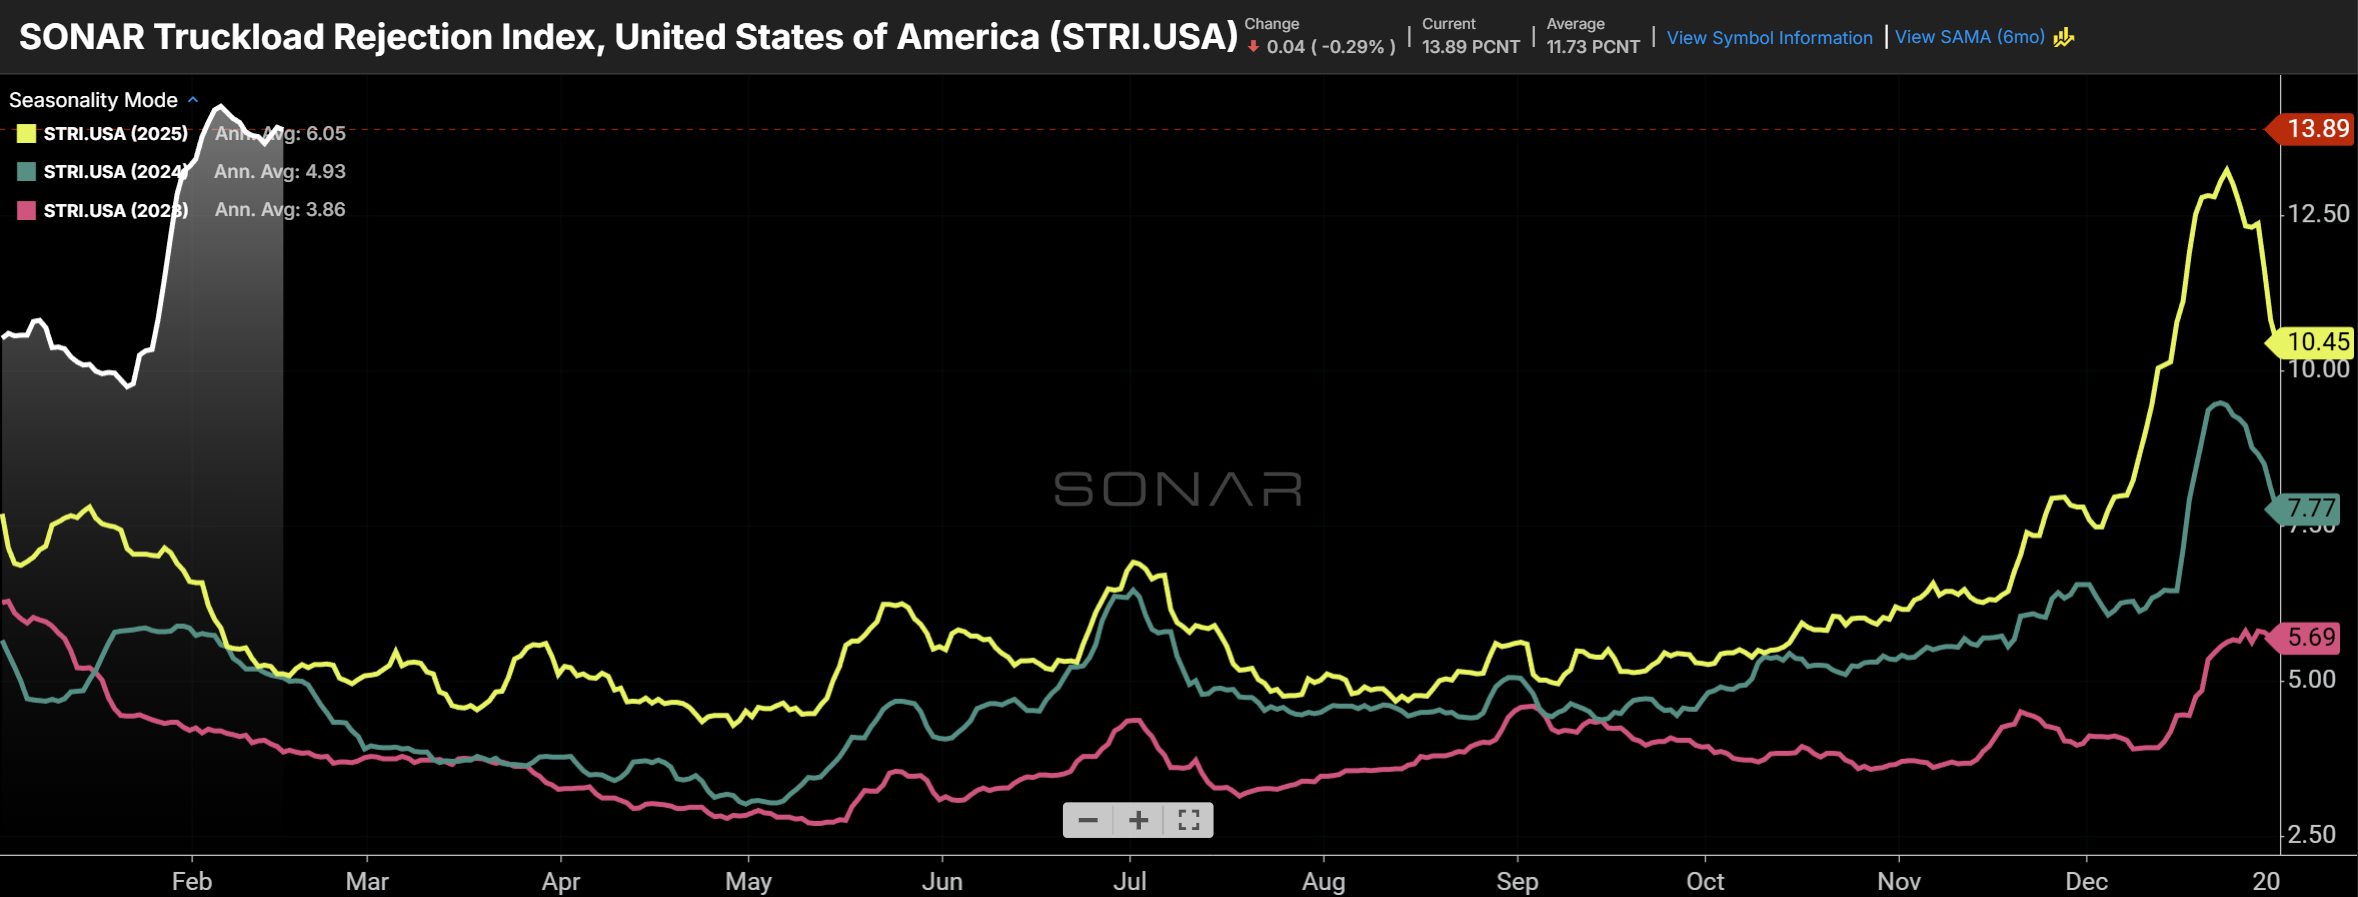
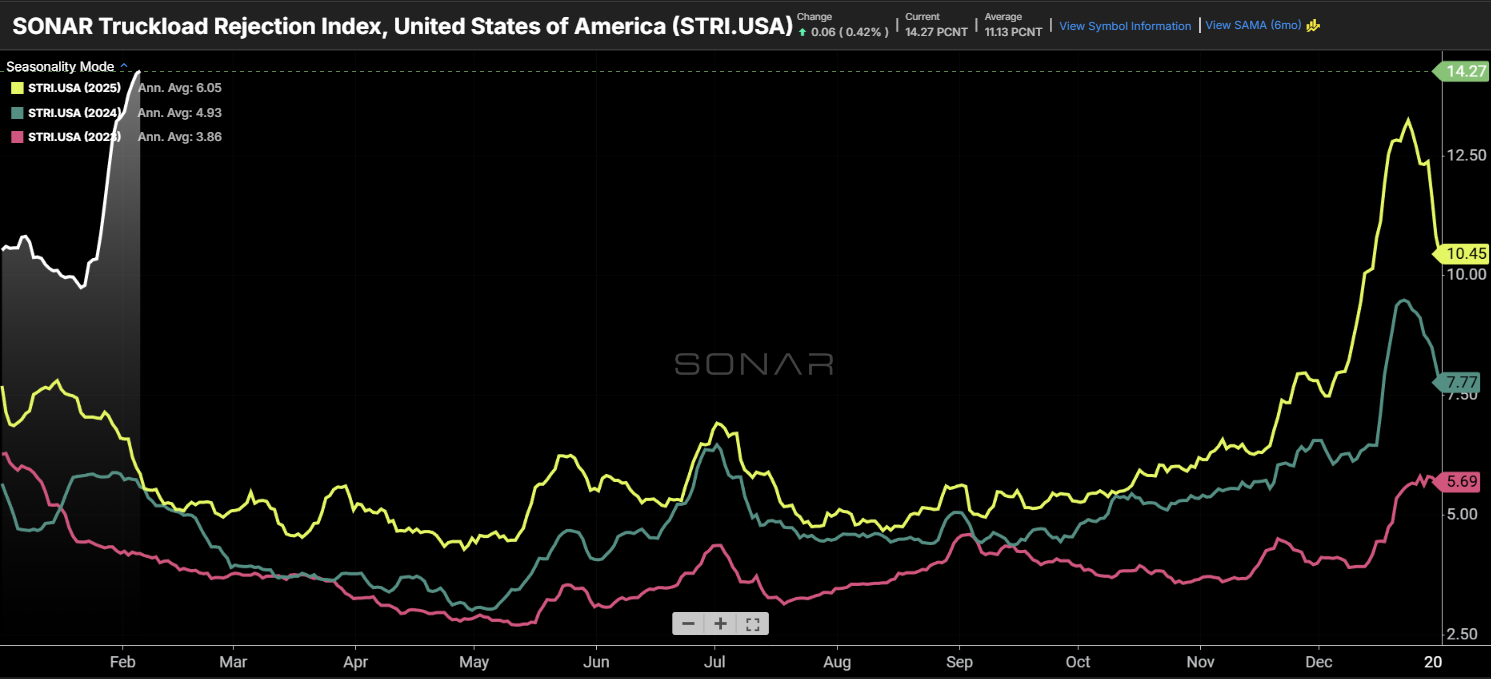
The national tender rejection rate (2026 – white line) is higher than at any point in the past three and a half years. (Chart: SONAR)
The spike in the tender rejection rate highlights Winter Storm Fern as one of the biggest events to temporarily limit capacity in recent years. It also shows that the freight market is tight enough to make it highly sensitive to disruptive events. The latest tender rejection rate, which reflects carriers’ response to requests to move loads during the past week, is 13.4%, up from 9.8% before Winter Storm Fern’s impact. The only winter storm that is comparable is the February 2021 Texas Freeze, which, under the backdrop of an already-tight freight market, sent the national tender rejection rate from 20% to 27%.

The SONAR Weighted Rejection Index reveals which markets, due to their respective sizes combined with their respective changes in market conditions, are having the most disruptive impact on the national freight market. In the past week, the most disruptive market was Memphis, followed by Dallas and Houston. (Chart: SONAR)
Some carriers opt to continue accepting loads during adverse conditions, recognizing that shippers will be understanding when it comes to slower service levels. But a coinciding rise in spot rates provided carriers with an incentive to chase more lucrative on-demand loads. The national average spot rate jumped from the high-$2.50/mile range before the storm to $2.75/mile, in line with last year’s holiday peak.

The average spot rate, displayed in the SONAR National Truckload Index (NTI.USA), surged following Winter Storm Fern, encouraging carriers to reject tenders. (Chart: SONAR)
Going forward, the question becomes how the data looks after operating conditions have become normalized. Even excluding any impact of unusually severe weather, the first quarter is when capacity most heavily leaves the market, as some carriers will choose not to renew authorities. Therefore, while the national tender rejection rate should certainly come down in the coming weeks, it may remain higher than the 7%-8% range that is usually high enough to move spot rates higher (a rise in contract rates then usually follows a sustained rise in spot rates). Even setting aside the weather impact, overall freight market conditions appear more in carriers’ favor than they have been in the first quarter since 2022, shortly before the start of the great freight market recession.

Tender rejection rates have risen across equipment types, with the most dramatic increases in the smaller and more specialized reefer and flatbed segments. The SONAR Truckload Rejection Index is shown above for dry van (blue), reefer (red), and flatbed (green) segments. (Chart: SONAR)
Demand is still lackluster

The SONAR Truckload Volume Index is roughly in line with levels of the past two years. (Chart: SONAR)
Total tender volumes increased 3.8% week over week, in the past week, across all semi-trailer types, and increased 6% week over week the week before that. It appears that some shippers attempted to move freight early ahead of the winter storm. Comparing volume data across modes suggests that truckload may have taken some share from rail intermodal as weather conditions made some shipments more urgent. Setting aside the impact of the storm, it’s not clear whether demand will be sustainable at or near year-ago levels once the impact passes. Prior to the dates impacted by the storm, tender volume had been down about 4% year over year, and about 6% on a two-year stack.
About the SONAR PPI: The SONAR Pricing Power Index is a qualitative assessment of the balance of negotiating power between shippers and carriers on a scale of 0 to 100 using SONAR data and anecdotes from discussions with SONAR clients. The higher the number, the tighter the freight market and the more that pricing power favors carriers. A 50 represents a balanced market. While the SONAR PPI primarily pertains to the truckload sector, given its size, dynamics in other sectors, such as intermodal and ocean, are also considered.