Northeast storms notwithstanding, freight data signals market turn
This week’s SONAR Pricing Power Index (PPI): 60 (unchanged) – The unchanged PPI reflects tender rejection rates and other freight data that are holding up well since the last report one week ago. Setting the blizzard in the Northeast aside, data suggest that freight markets in other parts of the country are not returning to their previous states that existed before Winter Storm Fern. If they had, I would be taking this week’s PPI down now, as I had anticipated two weeks ago. In particular, the freight market is showing tightness in the Midwest, where tender rejection rates have surged the most.
Three-month SONAR Pricing Power Index (PPI) Outlook: 65 (Up 5 points) – Freight data sets holding up better than expected provide added conviction to the view that the freight market should remain in carriers’ favor in three months, even in the absence of temporary disruptive events. In addition to cyclical factors, three months is right around Memorial Day, a strong seasonal period for beverages and bulky summer merchandise. The biggest risk to that outlook is a lack of ability and willingness to spend by middle and lower-income consumers, who appear to be cutting back on everyday items.
Tender rejection rates hold at high levels
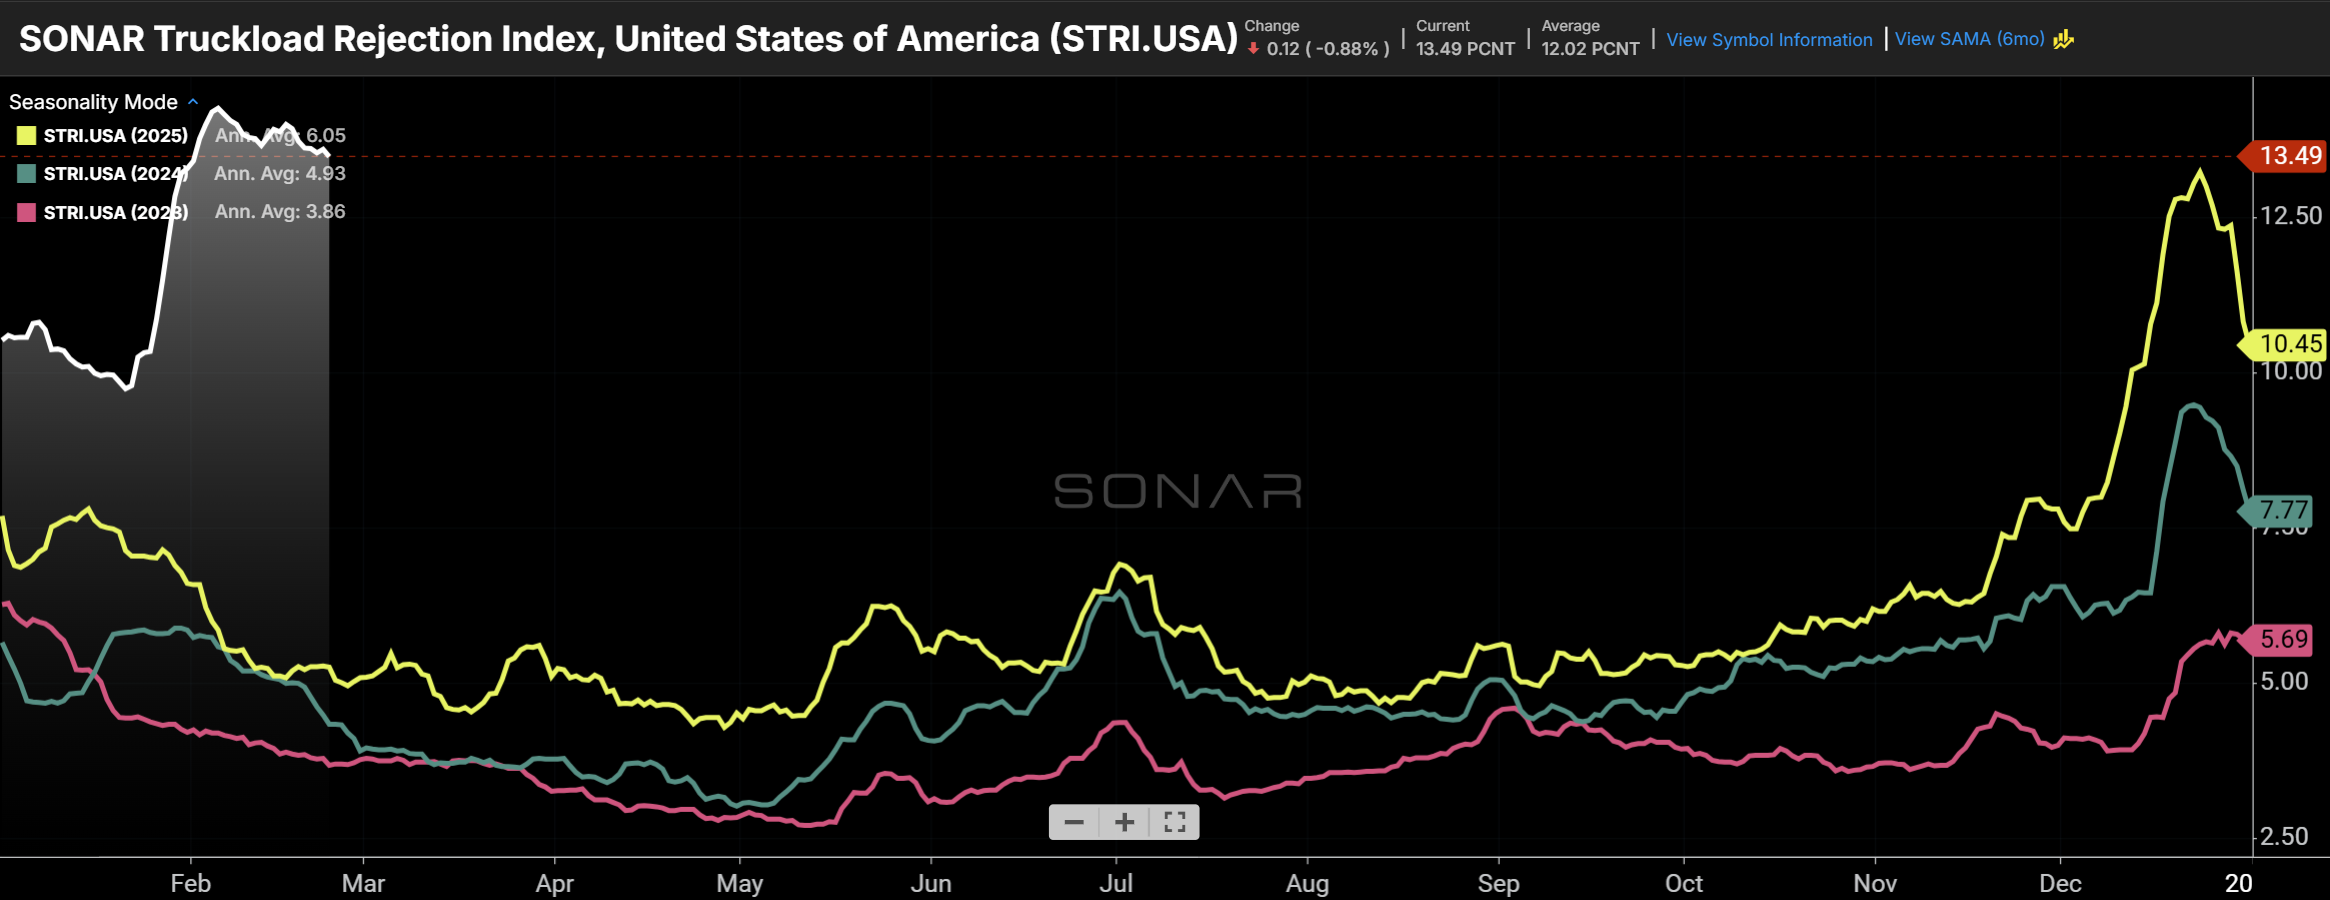
The national tender rejection rate (2026 – white line) is off its high, but continues to show freight market tightness. (Chart: SONAR)
The national tender rejection rate is off its high, but is holding up well. Currently, the national tender rejection rate is 13.5%, which represents the behavior of carriers in response to tenders in the past seven days, and is down only moderately from a high of 14.3% and from 13.9% one week ago. That rate was 9.8% before Winter Storm Fern, while seemingly on a downward trajectory, as it typically is in February. For comparison, following the February 2021 Texas Freeze, under the backdrop of an already-tight freight market, the national tender rejection rate increased from 20% to 27%. As we get further from the worst of the winter weather, it has become apparent that the freight market tightening is being driven primarily by supply and demand factors rather than weather.

Tender rejection rates have remained elevated across equipment types, but rates for the various equipment types moved in different directions in the past week, with reefer rejection rates continuing to move higher and flatbed and dry van rejections somewhat moderating. The SONAR Truckload Rejection Index is shown above for dry van (white), reefer (green), and flatbed (red) segments. (Chart: SONAR)
Elevated spot rates are turning into higher contract rates

The average spot rate, displayed in the SONAR National Truckload Index (NTI.USA), surged following Winter Storm Fern, and has remained above pre-storm levels. (Chart: SONAR)
The national average spot rate declined $0.06 in the past week from $2.79/mile to $2.73/mile. Before Winter Storm Fern, the average spot rate was around $2.55/mile. The peak last Christmas was $2.76/mile, and one year ago the average rate was $2.37/mile. Spot rates are highly volatile and may come down further in the coming weeks, but the past few weeks have demonstrated that carriers have pricing power that they didn’t have in the past few years, outside of short-lived periods surrounding disruptive events like holidays and International Roadcheck.

Rising spot rates have led to a collapse in the spread between contract and spot rates. That leads to pressure on brokers’ margins and rising contract rates. (Chart: SONAR)
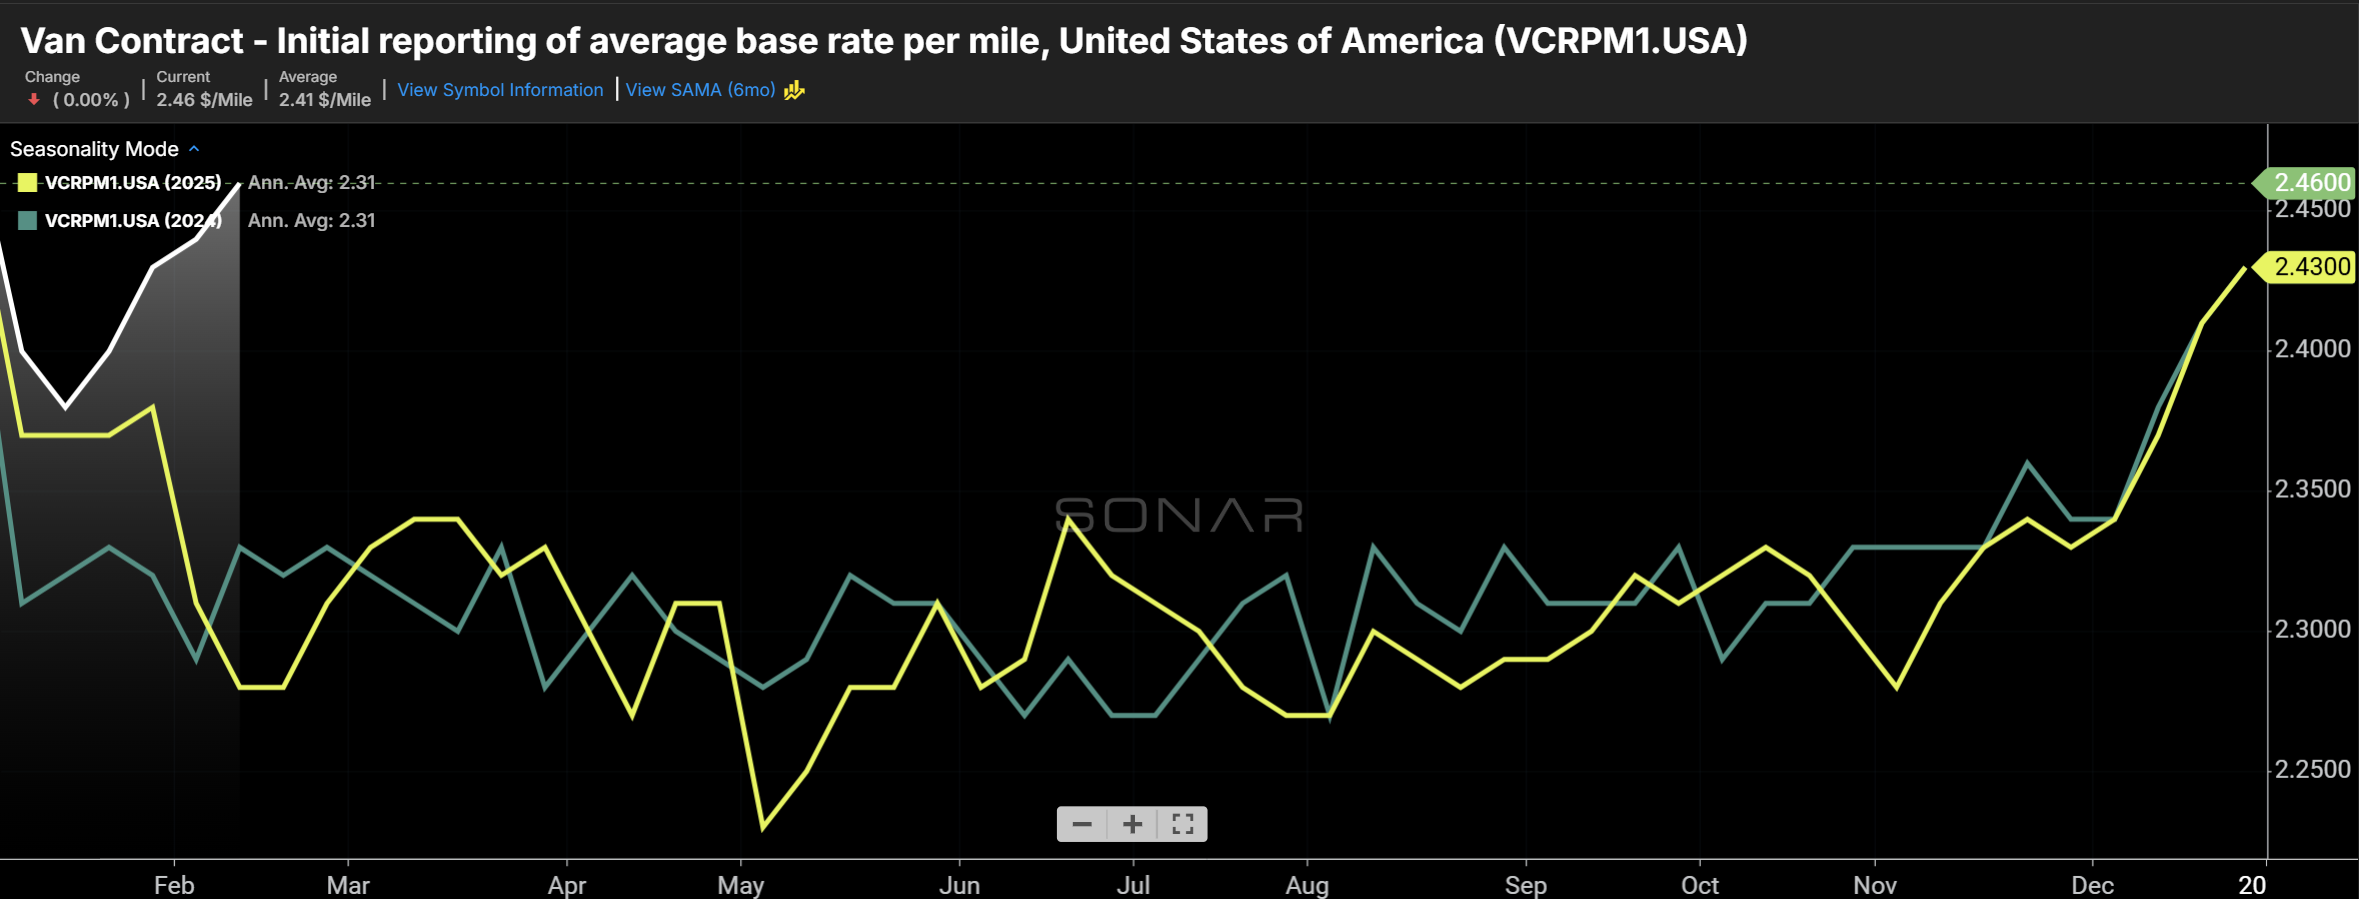
As expected, contract rates have not moved as quickly or as dramatically as spot rates, but they are now moving higher – the above chart shows dry van contract rates, excluding fuel surcharges. (Chart: SONAR)
Demand has normalized following the winter storms

Truckload tender volume surged in the days surrounding Winter Storm Fern, but has since retreated to only slightly above year-ago levels. (Chart: SONAR)
Total tender volumes in the past week are slightly ahead of year-ago levels and, following the winter storms, were trending higher by mid-single digits year over year. Prior to the dates impacted by the storm, tender volume had been trending down about 4% year over year, and down about 6% on a two-year stack. At a Wall Street conference in the past week, multimodal carrier J.B. Hunt said that demand was ‘a little bit more positive,’ exceeding earlier expectations issued to the Street in January.

The Weighted Rejection Index shows that the markets contributing the most to the tightening overall freight market are in the Midwest, which is outside of the locations getting hit worst by the latest winter storm. (Chart: SONAR)
Forward-looking demand metrics are mixed. The Class I railroads have called out the numerous headwinds they see in the industrial economy, particularly in housing and automotive, leading to cautious volume outlooks. The consumer economy is showing mixed messages, with pessimistic sentiment surveys, affordability concerns, and slowing hiring that are at odds with resilient consumer spending. Some CPG companies have said that consumers have become more cautious about small purchases, avoiding name-brand everyday items, and reducing basket sizes. The Supreme Court declaring the IEEPA tariffs illegal could spur demand for imports, which have, so far, contributed fairly little to the recent truckload market tightening, but much uncertainty remains on that topic, including whether they will just be replaced by tariffs under alternative grounds. For those reasons, demand remains the biggest risk to the PPI remaining above 50.

Intermodal service has never been better, which could take some volume from highway carriers in long-haul lanes, anchored by major cities. (Chart: SONAR)
About the SONAR PPI: The SONAR Pricing Power Index is a qualitative assessment of the balance of negotiating power between shippers and carriers on a scale of 0 to 100 using SONAR data and anecdotes from discussions with SONAR clients. The higher the number, the tighter the freight market and the more that pricing power favors carriers. A 50 represents a balanced market. While the SONAR PPI primarily pertains to the truckload sector, given its size, dynamics in other sectors, such as intermodal and ocean, are also considered.