Following end of 1Q surge, rejection rates decline and spot rates flatten
This week’s SONAR Pricing Power Index (PPI): 65 (down five points) – This past week, the national tender rejection rate and overall tender volume took steps down, which is to be expected to start April, which is normally a weak month for freight. Spot rates moved sideways at a high level. That broke a string of several weeks where the freight market looked progressively tighter. The current week’s PPI is a point estimate of where the freight market is currently, so a 5-point reduction is warranted. However, little else changed in the past week, and the freight market will likely show additional tightness as we get closer to International Roadcheck (May 12-14) and Memorial Day.
Three-month SONAR Pricing Power Index (PPI) Outlook: 75 (unchanged) – No data in the past week changes the 3-month outlook, which anticipates the freight market will tighten further in the second quarter.
Tender rejection rates pull back from recent highs

Despite the pullback in the past week and a half, the national tender rejection rate (2026 – white line) remains dramatically higher than first-half levels of the past three years. (Chart: SONAR)
In the past week, the national tender rejection rate declined from 14.0% to 12.9%. Two weeks ago, it was at 14.7%. A decline in the national tender rejection rate is typical to start a quarter, following an end-of-quarter freight surge, and that is particularly true of April, which is usually a weak month for freight before accelerating again in May. It also can’t be stressed enough that the decline was from its highest level in four years – four years ago was the approximate timing of the start of the freight market recession. So, my overall view of market conditions remains unchanged; it has fundamentally shifted to a carriers’ market and could remain one for an extended period.
Tender rejection rates declined in all the major SONAR tender data categories in the past week. The flatbed rejection rate, which had been the most elevated segment, had the most room to fall, declining from a 45% rejection rate to 34.8%, which still demonstrates tremendous market tightness. Flatbed rates are more volatile than other segments within the tender data because it is a thinner data set.

The SONAR Truckload Rejection Index is shown above for dry van (white), reefer (green), and flatbed (red) segments. (Chart: SONAR)
Spot rates flatten at a high level
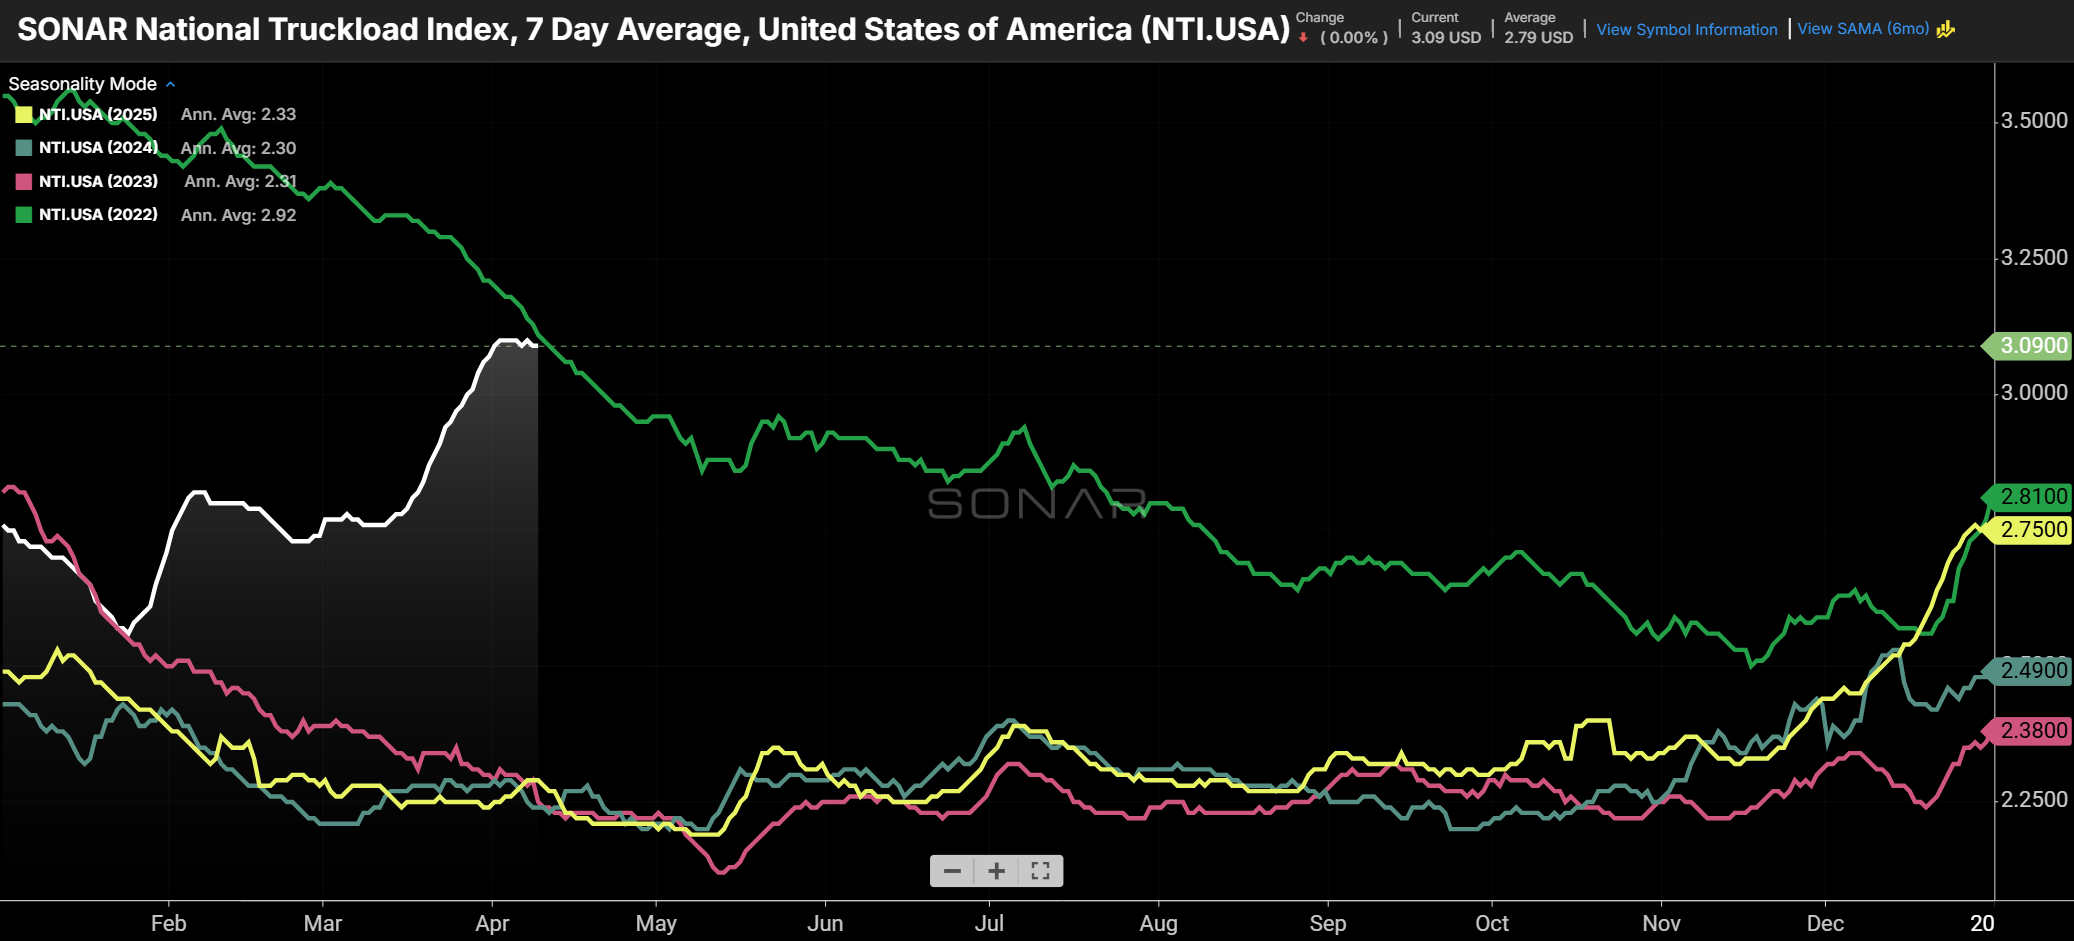
The average spot rate, displayed in the SONAR National Truckload Index (NTI.USA). (Chart: SONAR)
From the start of the Iran conflict up until this past week, it appeared that every day, the national average spot rate was higher than the last. In the past five weeks, the average spot rate went from $2.76/mile to $2.82/mile, to $2.98/mile, to $3.10/mile last week, before retreating to the latest reading of $3.09/mile. Spot rates are inclusive of fuel surcharges, and some have suggested that the higher rates are simply a function of carriers passing on surging fuel costs, which have risen ~45% since the start of the Iran conflict. Certainly, rising diesel prices are impacting spot rates, which are inclusive of fuel, but history shows that carriers are only successful in passing higher costs along when the market is tight, as it is now.

In the past week, the average spot rate declined by $0.01 while diesel prices continued to rise. While rising fuel prices have impacted the run-up in spot rates the past several weeks, that’s not the whole story. Comparing the average spot rate (white line) to diesel prices (orange line) shows that when the freight market is loose, carriers providing on-demand capacity struggle to pass along rising costs. A good example of that is the third quarter of 2023, when diesel prices rose, but spot rates stagnated. (Chart: SONAR)
Tender volume pulls back to start 2Q
Total truckload tender volume, which includes freight that is tendered for the first time as well as freight that has been rejected and re-tendered, declined to start the second quarter after surging to end the first quarter. However, the volume of accepted tenders declined much less than total tenders in the past week and is roughly in line with 2025 levels. That suggests that the decline in tender volume in the past week was primarily driven by a lower tender rejection rate. As a result, fewer loads were retendered. While the volume of accepted tenders (second chart below) is roughly in line with year-ago levels, that understates the volume of total freight movements, when compared to last year, because accepted tender volume does not include freight that falls through the routing guide and ultimately moves on the spot market.

Truckload tender volume declined to start 2Q. (Chart: SONAR)

The volume of accepted tenders is roughly in line with year-ago levels. (Chart: SONAR)
About the SONAR PPI: The SONAR Pricing Power Index is a qualitative assessment of the balance of negotiating power between shippers and carriers on a scale of 0 to 100 using SONAR data and anecdotes from discussions with SONAR clients. The higher the number, the tighter the freight market and the more that pricing power favors carriers. A 50 represents a balanced market. While the SONAR PPI primarily pertains to the truckload sector, given its size, dynamics in other sectors, such as intermodal and ocean, are also considered.